
Cart Abandonment Statistics 2026: How Much Revenue Are You Leaving on the Table?
Cart abandonment averages 70.22% across Baymard's 50 studies, most of which predate 2017, and a panel of 400+ brands measured 77.55% in the 12 months to July 2026. Rates by device, industry and region, the reasons shoppers give, and how each source measures abandonment.
Most cart abandonment statistics start and end with one number: 70.22%, the average Baymard Institute calculates from 50 studies. It is the right number to know, but it is an average of other companies' measurements, and the median study in it dates from 2013. A live panel of 400+ brands puts cart abandonment higher, at 77.55% over the 12 months to July 2026 (Dynamic Yield).
This article puts the two side by side and shows how they differ. It covers abandonment by device, industry and region, the reasons shoppers give for leaving, what recovery emails bring back, and how to measure your own rate on Shopify or WooCommerce. Each benchmark names its publisher, and its period wherever the publisher discloses one. For prevention and recovery tactics, see our complete cart abandonment guide.
Key cart abandonment statistics
- Baymard Institute's average documented is 70.22%, calculated from 50 studies (page updated September 22, 2025).
- 37 of the 50 studies in Baymard's list date from 2016 or earlier, and the median study year is 2013 (EcomHint count of Baymard's list).
- Dynamic Yield measured 77.55% cart abandonment across its 400+ brand panel over the 12 months to July 2026.
- Dynamic Yield puts mobile cart abandonment at 79.84%, tablet at 72.67% and desktop at 69.48% over the same 12 months.
- The gap between mobile and desktop narrowed every month from January to July 2026, from 11.3 to 8.8 percentage points (Dynamic Yield).
- December 2025 was the lowest month at 72.83%, against 77.52% to 78.70% in every month from January to July 2026 (Dynamic Yield).
- Beauty and personal care had the highest industry rate at 79.94% and pet care the lowest at 50.89% over 12 months (Dynamic Yield).
- The average Shopify store completes 45% of checkouts (Littledata, 2023 data).
- 42% of US online shoppers have abandoned a cart because they were "just browsing" (Baymard).
- Leaving "just browsing" aside, extra costs such as shipping, tax and fees are the most common reason for abandoning, at 40%, followed by slow delivery at 20% (Baymard).
- The average US checkout shows 23.48 form elements by default, against 12 to 14 in an ideal flow (Baymard).
- Abandoned cart emails averaged a 3.33% placed order rate and $3.65 revenue per recipient in 2023, the highest of any Klaviyo flow type (Klaviyo).
The Global Cart Abandonment Rate in 2026
Two numbers answer the question, and they measure different things.
Baymard Institute collects published studies of cart abandonment and averages them. Its list holds 50 studies, most of them from vendors that measured their own clients, such as SaleCycle, IBM, Listrak and Fresh Relevance, plus a few research firms such as Forrester and Comscore. The average is 70.22%, and the individual studies range from 55.00% to 84.27%.
Dynamic Yield publishes a monthly benchmark aggregated from 400+ brands and 200M+ monthly unique users (Dynamic Yield). It calculates abandonment as one minus completed purchases divided by carts created. Over the 12 months to July 2026, that came to 77.55%, with monthly readings between 72.83% and 80.07%.
The live panel runs about seven points above the familiar 70%. Neither figure is wrong. Baymard's 70.22% summarizes 50 published estimates with mixed definitions and periods. Dynamic Yield's 77.55% describes its own current dataset. Don't treat either one as a target for an individual store.
Dynamic Yield doesn't publish segment sample sizes, weighting, or whether the same brands contribute every month, and it describes its customers as "400+ forward-thinking enterprise businesses". Its device, region and category figures are useful context for a smaller Shopify or WooCommerce store, but they aren't a representative target for one.
Why the 70% Figure Barely Moves
The 70% figure is often quoted as proof that abandonment has held steady for a decade. Sorting Baymard's list by year shows why the average is slow to change: most of the studies in it are old.
| Study years | Studies | Average | Range |
|---|---|---|---|
| 2006 to 2012 | 19 | 67.0% | 55.0% to 80.3% |
| 2013 to 2016 | 18 | 71.6% | 60.3% to 78.0% |
| 2017 to 2019 | 5 | 73.6% | 56.8% to 81.4% |
| 2020 to 2025 | 8 | 72.7% | 57.6% to 84.3% |
Source: Baymard Institute list of 50 studies, grouped by study year by EcomHint, September 2026.
Only two studies are from 2023 or later: SaleCycle's 79.53% (2023) and Uptain's 71.72% (2025). A new study with a rate inside the list's current 55.00% to 84.27% range would move the average by about 0.3 percentage points or less, so the headline changes slowly.
The vendor says more about a figure than its year does. SaleCycle's eight studies range from 74.23% to 84.27%. IBM's nine, including those published as Coremetrics, range from 61.36% to 68.95%. In 2020 alone, SaleCycle reported 84.27% and Fresh Relevance 57.60%, about 27 points apart in the same year. Each source measures its own sample its own way, and the mix of sources changes between eras, so the list can't show whether abandonment is rising or falling.
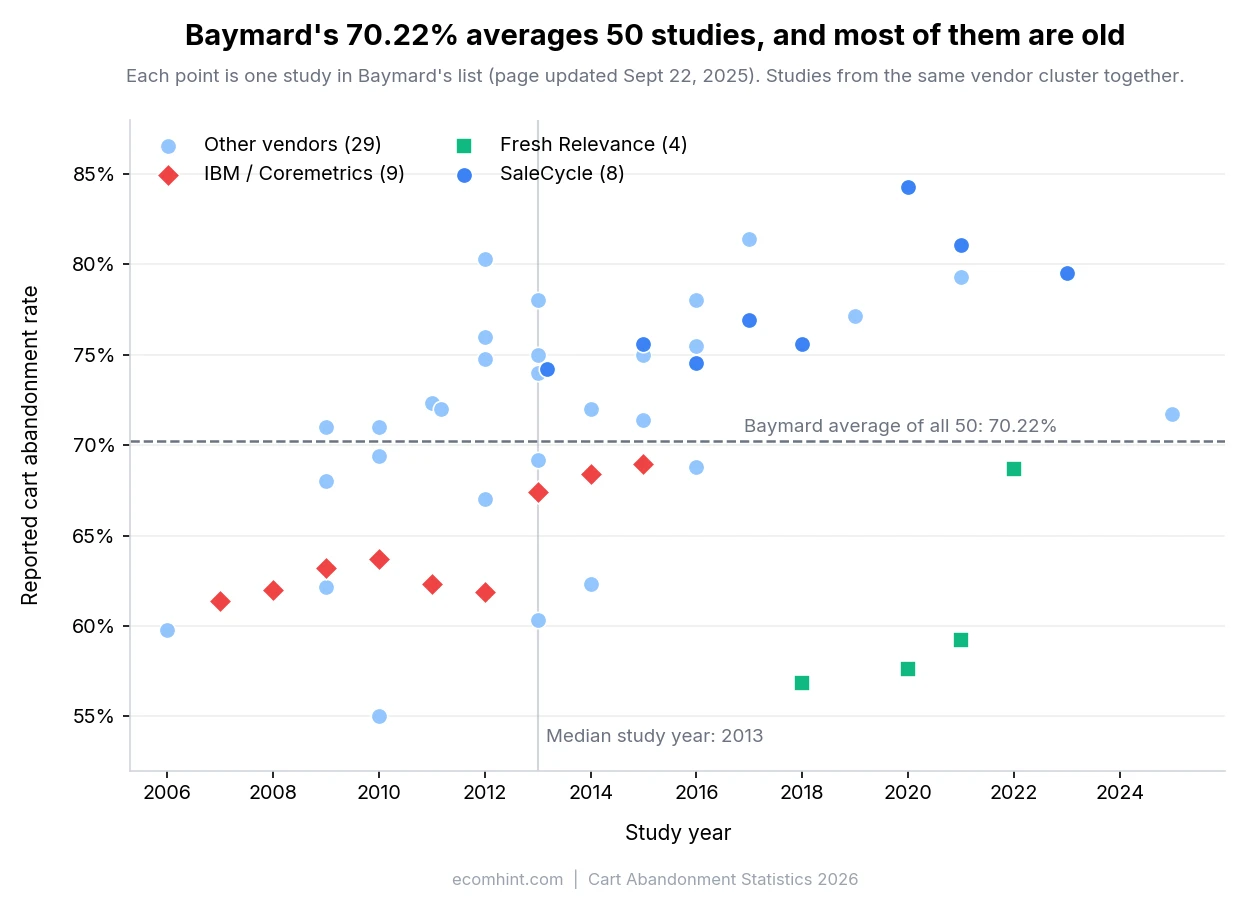
Source: Baymard Institute, 50 listed studies. Chart: EcomHint.
The December Dip
Dynamic Yield's monthly series has one clear low point. December 2025 came in at 72.83%, while every month from January to July 2026 sat between 77.52% and 78.70%. November was the second-lowest month at 75.81%. December was also the lowest month for 10 of the 14 device, region and industry segments Dynamic Yield reports.
Dynamic Yield's own conversion rate benchmark peaked in those two months, at 3.34% in November and 3.30% in December. In this 12-month window, more of the carts shoppers created in November and December ended in an order. One holiday season doesn't prove a recurring pattern, but if your store has the history, compare December with the previous December rather than with July.
See where your cart and checkout lose shoppers
Why Cart Abandonment Benchmarks Disagree
Every is a ratio, and the sources count different things on both sides of it. Some count carts, some count checkouts, and some count shoppers who answered a survey.
| Source | Period | Panel | Geography | Denominator | Counts as abandoned |
|---|---|---|---|---|---|
| Baymard, rate list | Studies from 2006 to 2025 | 50 third-party studies | Not disclosed per study | Each study's own | Each study's own definition, not stated |
| Dynamic Yield | Aug 2025 to Jul 2026, monthly | 400+ brands | Global, split into EMEA, Americas and APAC | Carts created | A cart with no completed purchase |
| Littledata | 2023 | 2,800 ecommerce sites, completion given for Shopify | Not disclosed | Not disclosed | A checkout that wasn't completed |
| Baymard, reasons survey | 2026 survey | 1,083 US adults who shopped online in the past 3 months | US | All respondents, multiple answers allowed | A self-reported online purchase abandoned in the prior 3 months |
| Shopify admin | Your store, last three months | Your checkouts | Your store | None (a list, not a rate) | A checkout where the shopper gave contact information and didn't complete the purchase |
| Klaviyo | 2023 | 143,000+ abandoned cart flows | Not disclosed | Email recipients | Not applicable (a recovery benchmark) |
"Not disclosed" means the publisher doesn't say, and this article doesn't fill those gaps with guesses.
Cart Abandonment vs Checkout Abandonment
Cart abandonment starts counting when an item goes into the cart. Checkout abandonment starts later, when the shopper begins checkout. In the same store, checkout abandonment is normally the lower of the two, because fewer shoppers start checkout than create carts. Benchmarks from different panels can't be used to bound each other, so a cart benchmark says nothing about how many checkouts should complete.
Littledata's Shopify benchmark covers the checkout stage. The average store completes 45% of checkouts, the top 20% more than 59% and the top 10% more than 66% (2023 data). On mobile the average is 44%, and on desktop 49%.
Shopify's admin reports the checkout stage too. Its Abandoned checkouts list covers checkouts where the shopper gave contact information and didn't complete the purchase (Shopify API docs). Stores still on the legacy abandoned checkout experience also wait 10 minutes after the email is entered, and both versions delete abandoned checkouts after three months (Shopify Help Center). A shopper who adds to cart and leaves before checkout never appears there. The abandoned checkouts list in your Shopify admin is a checkout-stage list, not a rate, so it isn't comparable with any cart abandonment benchmark.
Cart Abandonment by Device: Mobile's 80% Problem
Over the 12 months to July 2026, Dynamic Yield measured 79.84% cart abandonment on mobile, 72.67% on tablet and 69.48% on desktop. That is a gap of about 10 percentage points between phones and computers.
The device gap narrowed every month from January to July 2026, because desktop abandonment rose while mobile held near 80%. In January the gap was 11.3 points, and by July it was 8.8. Mobile barely moved, from 80.35% to 79.98%. Desktop rose from 69.07% to 71.17%. Dynamic Yield doesn't say why.
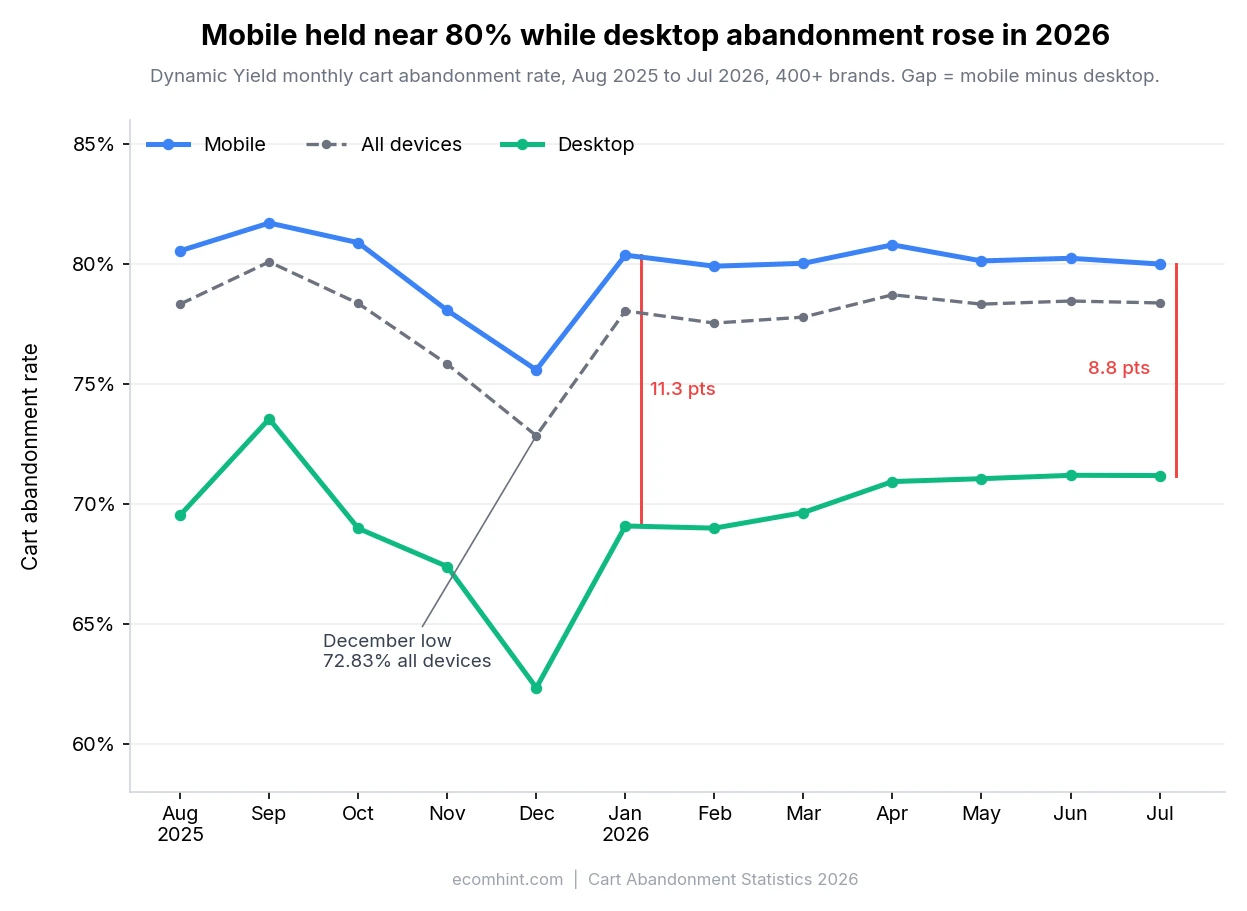
Source: Dynamic Yield monthly benchmark, August 2025 to July 2026, read September 23, 2026. Chart: EcomHint.
A different dataset shows the same direction at the checkout stage. Littledata found Shopify stores complete 44% of mobile checkouts and 49% of desktop checkouts (2023 data).
Why Mobile Abandonment Is Higher
None of these benchmarks breaks the causes down by device. These are the likely contributors:
- Checkout forms are long, and typing on a phone is slower. The average US checkout shows 1.7 to 2 times as many form elements as an ideal flow (see reason five below).
- When express wallets are missing or hard to find, mobile shoppers have to type card and address details by hand. A visible Apple Pay, Google Pay or Shop Pay button can cut that typing; our guide to express checkout covers where to place them.
- Part of the mobile rate is likely shoppers who were never ready to buy in that session, and none of the benchmarks here separates them out.
For the fields, keyboards and wallet placement that matter most on a phone, see our mobile checkout best practices.
Cart Abandonment Rates by Industry
Dynamic Yield reports eight retail categories from the same dataset, which makes them easier to compare than figures from different sources.
| Category | 12 months to Jul 2026 | July 2026 | Monthly range |
|---|---|---|---|
| Beauty & Personal Care | 79.94% | 80.35% | 76.34% to 81.46% |
| Luxury & Jewelry | 78.79% | 79.68% | 67.88% to 82.44% |
| Fashion, Accessories & Apparel | 78.68% | 78.79% | 73.82% to 80.04% |
| Home & Furniture | 78.48% | 75.54% | 75.54% to 81.04% |
| Multi-Brand Retail | 77.04% | 78.45% | 74.70% to 78.64% |
| Food & Beverage | 75.83% | 81.92% | 65.40% to 90.68% |
| Consumer Goods | 67.20% | 71.65% | 59.72% to 71.89% |
| Pet Care & Veterinary Services | 50.89% | 46.95% | 44.90% to 68.47% |
| All industries | 77.55% | 78.36% | 72.83% to 80.07% |
Source: Dynamic Yield, read September 23, 2026. Category 12-month figures are the average of the monthly values, the same method behind the category figures Dynamic Yield publishes. The all-industries 77.55% is Dynamic Yield's own headline; its monthly values average 77.71%.
Six of the eight categories sit within about four points of each other, between 75.8% and 79.9%. Consumer goods runs lower at 67.2%, and pet care is the outlier at 50.9%.
The highest-abandonment category depends on the month you read. Food and beverage swung from 90.68% in September 2025 to 65.40% in December, then climbed back above 80% from April 2026. It was Dynamic Yield's highest category in July, at 81.92%, yet sixth of eight over the full 12 months.
Pet care stepped down in February 2026, from around 52% to around 46%, and stayed there. Dynamic Yield's pet care order value also stepped down that month, to about a fifth below its 2025 level (see our average order value by industry breakdown). Two metrics moving at once is consistent with a change in which stores contribute, but Dynamic Yield doesn't publish its panel composition, so that can't be confirmed.
By region, APAC ran highest over the 12 months at 81.53%, followed by EMEA at 79.09% and the Americas at 74.50%.
Why Industry Matters
Dynamic Yield doesn't publish the product mix behind each category, so its data can't explain why pet care runs so low.
Category rates also don't line up neatly with Dynamic Yield's other metrics. Beauty has both the highest abandonment rate and the highest 12-month conversion rate in the dataset, at 5.39%. It also has the highest add-to-cart rate, at 9.56%. A high cart abandonment rate can coexist with high sitewide conversion and add-to-cart rates, so use the category figure as context and read your own cart-to-checkout and checkout-to-purchase trends before calling it a checkout problem.
Roundups often quote wider ranges, from around 50% for grocery to around 85% for travel. Dynamic Yield's panel doesn't include travel, grocery or electronics, so this table can't show them. The travel figures that circulate come from older vendor reports such as SaleCycle's client data, not a current panel, and travel bookings sit outside the retail stores this article is written for.
Top 8 Reasons Shoppers Abandon Carts
Baymard's 2026 survey asked 1,083 US adults who had shopped online in the past three months why they had abandoned an online purchase in that time. Respondents could pick more than one reason, so the shares add up to more than 100%. The top answer is one no checkout fix can touch: 42% were "just browsing / not ready to buy".
Baymard's chart is titled "Reasons for abandoning online purchases at checkout", while the page around it talks about carts. Treat the list as self-reported reasons, not as measured data or a breakdown of every abandoned cart.
Leaving browsing aside, these are the eight most common reasons on Baymard's current list.
1. Extra Costs Too High (40%)
Extra costs such as shipping, tax and fees remain the top fixable reason, cited by 40%. Roundups still quote 48% for this reason, a figure that doesn't match Baymard's current page. Show shipping costs, or at least your free shipping threshold, on product pages and in the cart. Our guide to setting a free shipping threshold covers how to pick one.
2. Delivery Was Too Slow (20%)
One in five surveyed shoppers had abandoned a purchase over slow delivery. Show an estimated delivery date before checkout, rather than a shipping speed the shopper has to convert into a date.
3. Didn't Trust the Site With Card Details (19%)
Recognizable payment options, a familiar checkout and visible contact details can reduce this. Our Shopify trust blind spots article covers the signals stores most often miss.
4. The Site Wanted Me to Create an Account (18%)
Offer guest checkout and invite an account after the order. Our comparison of guest checkout and account creation covers the trade-offs, including what Shopify lets you change.
5. Too Long or Complicated Checkout (17%)
Baymard's benchmark database shows the average US checkout displaying 23.48 form elements by default, and its testing puts an ideal flow at 12 to 14. Baymard says most checkouts could show 20% to 60% fewer form elements. Our checkout form design guide covers field reduction, autofill and mobile keyboards.
6. Website Had Errors or Crashed (17%)
Shoppers cite errors and crashes as often as a complicated checkout, at 17% each. Crashes need a technical fix, while clear, specific error messages can help shoppers recover from form and payment errors; see our guide to cart and checkout error messages.
7. Returns Policy Wasn't Satisfactory (13%)
Many shoppers look for the returns policy before they buy. Across 1,000 EcomHint store audits, around a third of stores left returns, shipping or policy links out of the footer.
8. Couldn't See or Calculate the Total Cost Up-Front (12%)
This is the other side of reason one. Show the subtotal and every known fee in the cart. Where shipping or tax depends on the destination, offer an estimator or say plainly that it's calculated once the shopper enters an address, then update the total as soon as you can.
Outside the top eight, Baymard lists a declined card (10%), not enough payment methods (9%) and "I don't know" (7%).
Find the cart and checkout issues costing you orders
The Revenue Impact of Cart Abandonment
Recoverable Revenue
Baymard's page says $260 billion in lost orders is recoverable in the US and EU through better checkout design (Baymard). The calculation applies a 35.26% conversion gain, which Baymard's checkout testing of large US and EU sites such as Walmart, Amazon and ASOS puts within reach of the average large site, to $738 billion of combined US and EU ecommerce sales.
The same figures appear in a September 2017 Baymard report for Amazon Pay, so the sales base is from then. Treat $260 billion as a historical estimate of potential for large sites, not a 2026 market figure or a measured recovery. The "$4 trillion abandoned" figure that appears in many roundups dates from a 2014 BI Intelligence estimate, so it isn't used here.
What a Lower Rate Is Worth
Abandonment is a share of carts, so the orders you keep are 100% minus the rate. Cutting the rate by five points adds five orders per 100 carts, and in relative terms that is worth more the higher you start.
| Starting abandonment rate | Orders per 100 carts now | Orders per 100 carts after a 5-point cut | Relative increase in orders |
|---|---|---|---|
| 80% | 20 | 25 | +25% |
| 75% | 25 | 30 | +20% |
| 70% | 30 | 35 | +17% |
| 60% | 40 | 45 | +13% |
For scale, five points is about the size of Dynamic Yield's December dip across its whole panel. For a store taking $100,000 a month at 75% abandonment, a five-point cut would mean around $20,000 more a month, if the number of carts and the order value stay the same. They rarely stay exactly the same, so use the result as a planning figure rather than a forecast.
Cart Abandonment Email Recovery Rates
Recovery emails only reach shoppers who left a usable email address. In Shopify's newer abandoned checkout automation, they also go by default only to customers subscribed to email marketing (Shopify Help Center). For the shoppers they do reach, Klaviyo's benchmark of more than 143,000 abandoned cart flows sent in 2023 gives the clearest numbers.
| Metric | Average brand | Top 10% |
|---|---|---|
| Open rate | 50.5% | 65.34% |
| Click rate | 6.25% | 13.33% |
| Placed order rate | 3.33% | 7.69% |
| Revenue per recipient | $3.65 | $28.89 |
Abandoned cart flows had the highest revenue per recipient and placed order rate of any Klaviyo flow type. Their revenue per recipient ran 37.74% above the next-best flow, welcome emails. For contrast, Klaviyo's 2026 benchmarks put the average campaign placed order rate at 0.16%, in a separate report published in February 2026. The two figures come from different reports and years, so treat the gap as a direction rather than a precise multiple.
Omnisend's 2026 report, based on 2025 data from 150,000 brands, adds a different measure: abandoned cart and welcome messages together produced 76% of all automation-generated orders.
Compare placed order rate and revenue per recipient rather than opens, because they reflect orders and revenue. For timing, sequence length and 50+ subject line examples, see our cart abandonment email subject lines guide.
How to Calculate Your Cart Abandonment Rate
The formula Dynamic Yield uses is the standard one:
Cart abandonment rate = (1 − completed orders ÷ carts created) × 100
Dynamic Yield's own example uses 200 purchases from 850 carts, which gives 76.47%, or 76% rounded. Our cart abandonment calculator runs this on your numbers and compares the result with the category figures above.
On Shopify
Shopify has no metric called cart abandonment rate, but its analytics cover both stages (Shopify Help Center).
- Checkout abandonment is 100% minus Shopify's , which it defines as sessions that completed checkout divided by sessions that reached checkout.
- For cart abandonment, open the breakdown report under Analytics > Reports and switch the Open Funnel toggle off. The closed funnel only counts sessions that added to cart, reached checkout and completed it in that order (Shopify Help Center). Cart abandonment is then roughly 1 minus completed checkouts divided by sessions with cart additions. These rates are built on sessions, which Shopify started counting differently on September 21 to 23, 2026, so compare periods on the same side of that date.
Both are session-based, so they won't match Dynamic Yield's cart-based figure exactly. Shopify's session data only goes back to October 1, 2022. Shopify also changed how it measures sessions between September 21 and 23, 2026, which moves session-based rates including Checkout conversion rate even when orders don't change (Shopify Help Center). Treat data from after the update as a new baseline rather than comparing across it.
On WooCommerce
WooCommerce's built-in Analytics has 11 reports, covering revenue, orders, products, customers, stock and similar, and none of them covers carts, checkouts or sessions (WooCommerce docs). If GA4 ecommerce events are set up on the store, a funnel exploration from add_to_cart to purchase gives a proxy. It counts users rather than carts, and each user enters the funnel only once per date range (Google Analytics Help), so it won't match the cart-based formula above. For a carts-created denominator, use an extension that records carts. WooCommerce 11.0 adds an experimental recovery email, off by default, that sends one reminder two hours after a checkout sits in Pending payment (WooCommerce docs).
What's a "Good" Abandonment Rate?
Compare your rate with the same device, category and month before you judge it. A single target misleads more than it helps.
- Compare mobile with mobile. Dynamic Yield's mobile average is 79.84% and its desktop average 69.48%, so a store with mostly mobile traffic should expect a higher blended rate.
- Use your category as context, not as a pass mark. A 60% rate sits above Dynamic Yield's pet care figure and below its beauty figure, but that alone doesn't show whether a store has a problem. Your own same-stage, same-device trend says more.
- Compare a month with the same month a year earlier, since December ran about five points below the rest of the year in Dynamic Yield's latest window.
- Check which stage you're measuring. Shopify's Checkout conversion rate is the figure to set beside Littledata's 45% checkout completion, not beside 70%.
- Mind the volume on a small store. A handful of orders can move a monthly rate by several points, so judge a trend over enough carts to mean something.
Frequently Asked Questions
What is the average cart abandonment rate in 2026?
Baymard Institute's average of 50 studies is 70.22%. Dynamic Yield's panel of 400+ brands measured 77.55% over the 12 months to July 2026. They measure different things: Baymard averages past studies, most from before 2017 and each with its own definition, while Dynamic Yield measures current carts across the brands in its dataset.
What is the difference between cart abandonment and checkout abandonment?
Cart abandonment counts carts that never become orders. Checkout abandonment only counts shoppers who started checkout and then left. Littledata puts the average Shopify at 45% (2023 data), and Shopify's Abandoned checkouts list only covers checkouts where the shopper gave contact information.
Which industry has the highest cart abandonment rate?
Over the 12 months to July 2026, beauty and personal care had the highest rate in Dynamic Yield's panel at 79.94%, and pet care the lowest at 50.89%. The ranking shifts from month to month: food and beverage was the highest category in July 2026, at 81.92%.
What is the main reason shoppers abandon carts?
The most common reason is not being ready to buy: Baymard reports that 42% of US online shoppers have abandoned a cart while just browsing. Among the remaining reasons, extra costs such as shipping, tax and fees lead at 40%.
How is cart abandonment rate calculated?
Divide completed orders by carts created, subtract the result from one and multiply by 100. For example, 200 orders from 850 carts gives a cart abandonment rate of 76.47%, or 76% rounded, the example Dynamic Yield uses.
Do cart abandonment emails work?
Klaviyo's 2023 benchmark of more than 143,000 abandoned cart flows found an average placed order rate of 3.33% and revenue per recipient of $3.65, the highest of any flow type. The top 10% of brands reached 7.69% and $28.89.
From Statistics to Action
Start with cost, since extra costs lead Baymard's fixable reasons at 40%. Put shipping costs or a free shipping threshold on product pages and in the cart, since 12% also cited not being able to see the total up-front.
Then shorten the checkout, especially on mobile. The form-element gap from reason five is the one to close, and wallets remove most of the typing.
Finally, track cart and checkout abandonment separately and by device, so each one can be set beside the benchmark that measures the same thing.
To check whether a change worked, record both rates for a fixed period before you make it, and don't let the comparison straddle a change in how your platform measures sessions. Afterwards, compare the same device, traffic source and promotion mix over a period of similar length, and wait for enough carts that a few orders can't swing the result. Watch total orders, order value and payment failures alongside abandonment, since a lower rate that comes with fewer orders isn't a win.
For prevention and recovery strategies, see our complete cart abandonment guide, and for checkout-specific tactics, the checkout optimization guide.

Jakub is the founder of Ecomhint, an AI-powered ecommerce audit tool focused on UX and conversion optimization. He helps online stores identify friction points across product pages, cart, and checkout using CRO best practices and original research data.
