
Average Order Value by Industry: 2026 Ecommerce Benchmarks
Average order value benchmarks for 2026, read directly from Dynamic Yield, IRP Commerce and Littledata: AOV across eight ecommerce verticals, with luxury at $569 and pet care at $61, plus device and region gaps and a September 2026 comparison of AOV with estimated revenue per visitor.
Two stores can both call themselves "average" and sit hundreds of dollars apart. In Dynamic Yield's September 2026 data, luxury and jewelry stores averaged around $569 per order while pet care stores averaged around $61. That ninefold spread is why a single "good" is close to useless. The figure that matters is the one for your industry.
This guide reads average order value benchmarks directly from the publishers that measure ecommerce orders: Dynamic Yield, IRP Commerce and Littledata. It breaks down by industry, device and region, and shows why the category with the highest order value earns less per visitor than several lower-priced categories. Run your own figure first with the AOV calculator, then read it against the benchmarks below. For statistics on the rest of the store, grouped by topic, see our ecommerce benchmarks and statistics.
Key average order value statistics
- Dynamic Yield put average order value at $228 in September 2026; its twelve-month figure of $182 includes a broken July.
- Luxury and Jewelry leads at $569 per order, and Pet Care is lowest at $61 (Dynamic Yield, September 2026).
- Desktop orders ran around $266 in September 2026, against $216 on mobile and $214 on tablet (Dynamic Yield).
- IRP Commerce measured UK and Irish AOV at £129.23 in August 2026, up 6.28% year over year.
- The median store in Littledata's September 2026 benchmark of 421 Shopify stores had an AOV of $110, and anything above $288 put a store in the top 20%.
- Revenue per visitor varies far less than AOV for most categories: in Dynamic Yield's September 2026 data, conversion times AOV gives $2.83 to $4.37 for five of eight categories, despite a sevenfold spread in their AOV.
- Dynamic Yield's July 2026 AOV fell by between 83% and 86% in seven of its eight categories at once, while its July conversion rates stayed normal.
What Is the Average Order Value Across Ecommerce
Average order value is the mean amount a customer spends per order. The formula is simple:
AOV = Total Revenue / Number of Orders
Dynamic Yield's live benchmark currently shows $182 as its twelve-month global average, and that figure needs a warning before anyone quotes it. The twelve months run through September 2026 and include July, which came in at $34 against $207 in June. Seven of its eight categories fell by between 83% and 86% in the same month, while Dynamic Yield's July conversion rates by category and its overall units per order moved by ordinary amounts. Consumer goods fell only 15%, because its order value had already dropped by almost four-fifths in May, to $55, a step Dynamic Yield hasn't explained either. Shoppers bought about as often and put about as many items in each order, yet revenue per order collapsed. That points to a measurement problem rather than a change in spending, though Dynamic Yield has not said what happened. The twelve-month figures include that month, so they currently understate the level: leaving July out lifts most segments by around 7 to 8%, and luxury by nearly a fifth. Dynamic Yield also restates earlier months: June 2026 read $226 in September and shows $207 now. This guide uses September 2026, the latest month, read on October 6, 2026.
On that basis, AOV across Dynamic Yield's panel was $228 in September 2026. That number is still less useful than it looks, for a reason every benchmark here shares: they measure different stores in different ways.
| Source | Period used here | Panel | Geography | What AOV includes |
|---|---|---|---|---|
| Dynamic Yield | September 2026, plus the monthly series since October 2025 | 400+ brands, 200M+ monthly users | Global, split into three regions | Not disclosed |
| IRP Commerce | August 2026, monthly | Independent merchants on the IRP platform | Great Britain, Northern Ireland, Ireland | Revenue divided by orders; tax, shipping and returns not disclosed |
| Littledata | June 29 to September 26, 2026 | 421 Shopify stores that send data to GA4 through Littledata | Not disclosed; revenue converted to US dollars | Purchase revenue divided by orders; tax, shipping and returns not disclosed |
None of the three says whether its revenue figure includes sales tax, shipping or returns, and for AOV that matters more than it does for conversion. IRP reports in pounds, and the UK's standard VAT rate is 20%, so for standard-rated goods whether a benchmark counts tax can move it by up to a fifth on its own. Decide what your own AOV includes before comparing it with anyone else's.
The bigger driver is unit price. A category selling $300 watches will post a higher AOV than one selling $12 lip balms, however good either store is at merchandising. Comparing a fashion brand's AOV to the all-industry average tells you almost nothing; comparing it to other fashion brands tells you whether you are leaving money on the table.
Key takeaway: Treat the cross-industry average as trivia. Your benchmark is your own vertical, because unit price drives most of the difference between categories.
See how your store's AOV stacks up against your industry
Average Order Value by Industry Benchmarks
These are Dynamic Yield's figures for September 2026, read on October 6, 2026 from the chart on its benchmark page, filtered by industry; the page's headline text shows the twelve-month figures instead. The range column shows each category's lowest and highest month between October 2025 and September 2026, leaving out the broken July, which says as much as the headline about how far to trust it.
| Industry | AOV, September 2026 | Monthly range, Oct 2025 to Sep 2026, excluding July |
|---|---|---|
| Luxury & Jewelry | $569 | $370 to $569 |
| Fashion, Accessories & Apparel | $390 | $147 to $390 |
| Home & Furniture | $240 | $210 to $308 |
| Multi-Brand Retail | $124 | $106 to $124 |
| Food & Beverage | $92 | $80 to $96 |
| Beauty & Personal Care | $79 | $71 to $88 |
| Consumer Goods | $62 | $48 to $327 |
| Pet Care & Veterinary | $61 | $52 to $79 |
Dynamic Yield's luxury series is missing October 2025. Its published twelve-month figure of $421 matches the reported months divided by twelve, as if that month were zero, so the luxury range above covers the ten months outside July that it does report.
The ranges matter as much as the September figure. Food, beauty and multi-brand retail move within about $20 from month to month, so a single month is a fair benchmark for them. Pet care stepped down by about a fifth in February 2026 and has stayed near that level since. Home and furniture stepped up by a similar amount in February and fell back from June. Luxury, consumer goods and fashion swing widely, so for those a single month is a weak anchor: consumer goods dropped to $55 in May and hasn't recovered, and fashion's jump coincides with a shift covered in the region section below.
Typical reasons behind each figure:
- Luxury & jewelry ($569). High unit prices and considered, infrequent purchases. One order is often the whole relationship for a while.
- Fashion & apparel ($390). Not basket size: Dynamic Yield's own basket data puts fashion at 2.94 items per order over twelve months, against 3.99 across all categories, so the value comes from price per item. Before December 2025 this category sat around $150, and the jump is covered in the region section.
- Home & furniture ($240). Big-ticket items and bundled rooms. A sofa often brings a rug or a lamp into the same order.
- Multi-brand retail ($124). Marketplaces and general stores spanning cheap and mid-price items.
- Food & beverage ($92). Low unit prices offset by basket size. Dynamic Yield's food and beverage orders held between about 5 and 12 items a month until its basket series for the category stops in June 2026.
- Beauty & personal care ($79). Low unit prices. Dynamic Yield puts beauty at the most items per order of any category over twelve months, 7.48, yet orders still average under $80.
- Consumer goods ($62). A broad bucket Dynamic Yield does not define, and the most volatile in the table, with monthly values as high as $327 in October 2025 and as low as $48 in August 2026.
- Pet care ($61). Frequent replenishment orders for food and treats rather than large one-off purchases.
For a second panel, IRP Commerce measures UK and Irish sectors monthly. Its overall AOV was £129.23 in August 2026, up 6.28% from £121.59 a year earlier. Its highest-AOV sector that month was Baby and Child at £855.57 and its lowest was Health and Wellbeing at £48.78. Baby and Child is also IRP's lowest-converting sector, at 0.57% in the same month, which is the trade-off the revenue-per-visitor section below puts numbers on.
A low AOV is not automatically a problem. A beauty brand at $79 with strong repeat purchase can out-earn a furniture store at $240 that sells to each customer once. AOV is one lever, not the scoreboard.
Desktop vs Mobile AOV
The industry table hides a second gap that sits inside almost every store. In September 2026, Dynamic Yield recorded desktop orders at $266, mobile at $216 and tablet at $214, so a desktop order was worth roughly 23% more than a mobile one. September sits at the low end, though: across the eleven months between October 2025 and September 2026, leaving out July, the monthly desktop premium ran between about 23% and about 76%, and it topped 50% in four of them.
The benchmark shows the gap, not its cause. Product mix, traffic source, customer mix and shoppers who browse on a phone but buy on a laptop can all produce it. So benchmark by device, not only in aggregate, and if your desktop premium runs well beyond that range, segment both devices by product category and traffic source before reading anything into it. A gap that survives that split is worth checking against your mobile product pages and cart, where add-on items most often get lost; clearer blocks, easier bundle adds and a free-shipping that survives a small screen are the usual places to start.
Average Order Value by Region
Dynamic Yield's September 2026 regional split put EMEA at $248, the Americas at $165 and APAC at $127. Read as a snapshot, that says EMEA orders run about half as large again as those in the Americas.
The monthly series says something different: EMEA's lead only appeared in December 2025. In October and November 2025, EMEA sat at $153 and $112 and trailed the Americas. In December it jumped to $205, and in every month since, July aside, it has stayed between $198 and $266, while the Americas and APAC showed no comparable step. Fashion shows the same step in the same month: it sat at $147 to $151 before December and between $239 and $390 from December on, again leaving out July.
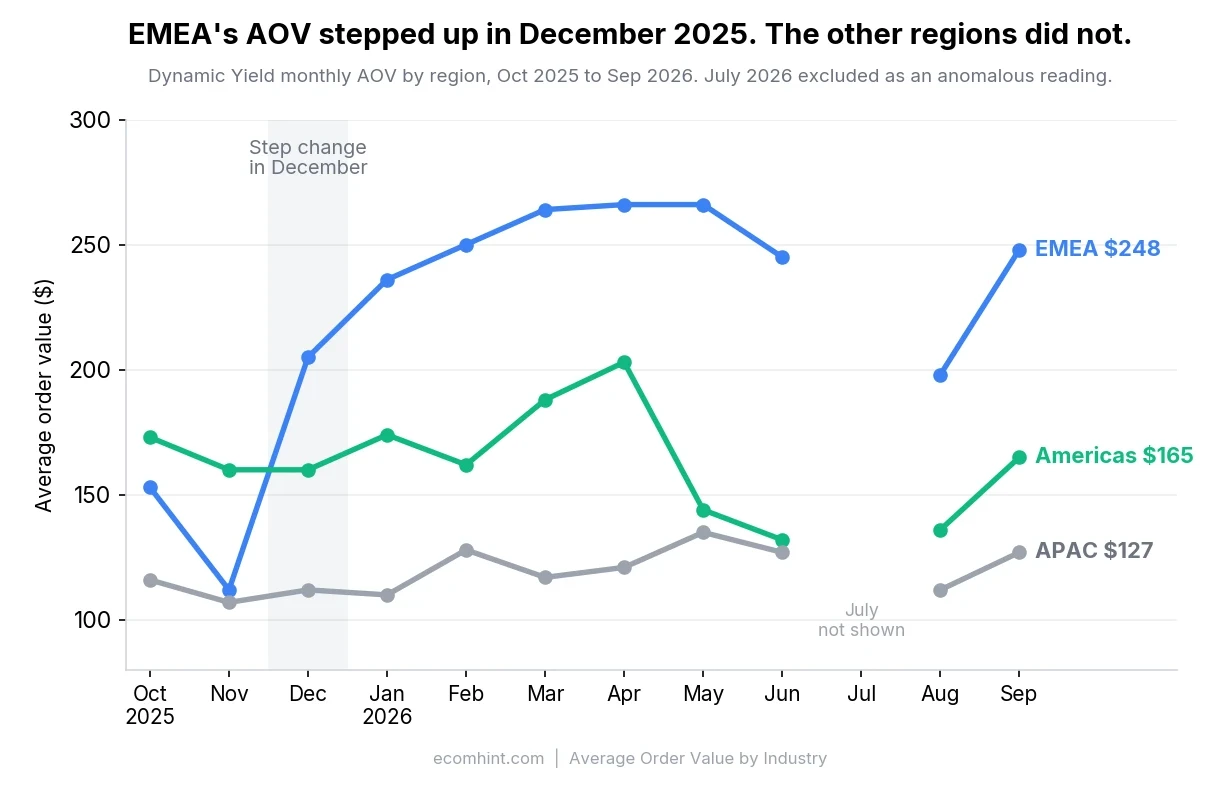
Shoppers in one region and one category rarely change their spending that abruptly while the Americas, APAC and most other categories show no step of that size. The pattern is consistent with a change in which brands sit in the panel, and Dynamic Yield does not publish changes to its panel, so there is no way to confirm it. What it does mean is that the regional ranking, the fashion figure and the $182 twelve-month headline all rest partly on that shift. Treat them as a description of the current panel rather than of the market.
If you sell internationally, segment your own AOV by region before you judge it. A blended global figure can hide a strong EMEA basket behind a thinner APAC one, or the reverse, and that masks where your merchandising already works.
Revenue per Visitor by Industry
AOV tells you how much each order is worth. How often visitors order is the other half, and Dynamic Yield publishes both for the same categories from the same panel. Multiplying its conversion rate by its AOV for the same month, both read from its filtered benchmark charts, gives an estimate of revenue per visitor:
| Industry | Conversion, September 2026 | AOV, September 2026 | Revenue per visitor |
|---|---|---|---|
| Fashion, Accessories & Apparel | 2.59% | $390 | $10.10 |
| Food & Beverage | 4.75% | $92 | $4.37 |
| Beauty & Personal Care | 5.21% | $79 | $4.12 |
| Multi-Brand Retail | 2.55% | $124 | $3.16 |
| Luxury & Jewelry | 0.54% | $569 | $3.07 |
| Home & Furniture | 1.18% | $240 | $2.83 |
| Consumer Goods | 1.81% | $62 | $1.12 |
| Pet Care & Veterinary | 1.65% | $61 | $1.01 |
AOV runs ninefold from pet care to luxury, and conversion runs nearly tenfold the other way, with luxury at 0.54% and beauty at 5.21%. Revenue per visitor stays between $2.83 and $4.37 for five of the eight categories. High order values and low conversion rates largely offset each other. Luxury, the AOV leader, earns $3.07 per visitor, in the lower half of the table, while beauty, with an AOV under $80, earns more.
Fashion is the exception at the top, at $10.10, and it rests on the same December jump covered in the region section. At its September conversion rate but its pre-December AOV of around $150, fashion would earn roughly $3.90 per visitor, inside the pack. Consumer goods and pet care sit at the bottom, near $1, for reasons that look specific to this panel: consumer goods' AOV has stayed near $50 to $60 since May, and pet care's conversion rate fell to 1.65% in September, down from 6.85% in August.
Two cautions. This is one month of one panel, and pet care's conversion rate swung between 1.65% and 7.68% across the twelve months to September 2026, so its row is the least stable. And because Dynamic Yield divides by users rather than sessions, the figure is closer to revenue per user than to the per-session number most analytics tools report. For the conversion side in more depth, see our ecommerce conversion rate benchmarks by industry, which uses Dynamic Yield's twelve-month rates, so its figures differ from the September ones here.
Key takeaway: The category with the highest AOV is not the one that earns most per visitor. Judge your AOV next to your conversion rate, not on its own.
How to Calculate Your Own AOV Correctly
The formula is one line, but the inputs decide whether your number is comparable. Four rules keep it honest.
Know which definition your number already uses. Shopify's own sales report takes gross sales minus discounts, divided by orders, and leaves returns and other post-order adjustments out. If you build your own figure on net revenue instead, subtracting refunds as well, it will run lower than the one your platform shows, so pick one rule and note it.
Decide on shipping and tax once and stay consistent. Product-only revenue is usually the cleanest internal default, but matters more than the choice. None of the benchmarks above discloses its own rule, so your comparison against them is only as clean as your own consistency.
Segment before you judge. A single blended AOV across new and returning customers, paid and organic traffic, and every region can bury the story. The AOV calculator handles the arithmetic; the is on you.
Check your median or most common order value too, not only the mean. A handful of large orders can pull the average above the basket most customers actually place, as Shopify's breakdown of mean, median and mode order value shows: in its example the mean lands at $24 while the most common order is just $15. If your AOV sits well above your most frequent order size, build your threshold and upsell strategy around the common basket.
How to Read Your AOV Against the Benchmark
Start by computing your own number for the same period, ideally the last 90 days, using the revenue and order definitions you settled on above. Then place it in a distribution, not just against an average. Littledata's September 2026 benchmark of 421 Shopify stores publishes the cutoffs, measured over the 90 days to September 26, 2026:
| Where you sit in Littledata's Shopify benchmark | AOV |
|---|---|
| Bottom 20% | Below $62 |
| Median | $110 |
| Top 20% | Above $288 |
| Top 10% | Above $643 |
Littledata's median sits far below Dynamic Yield's $228, and the two differ on too many counts to say why: the middle store among 421 Shopify stores against a panel-wide figure for 400+ enterprise brands, with neither saying what its revenue includes. Use it for the shape of the distribution, where the top-10% cutoff runs nearly six times the median, rather than as a market-wide level.
A worked example makes this concrete. Say you run a home goods store and your last 90 days show $180,000 in revenue across 900 orders, an AOV of $200. Against Dynamic Yield's September figure of $240 for home and furniture, you are running roughly 17% below your vertical, a directional read since the periods and revenue definitions differ. Closing half that gap, to about $220, would add close to $18,000 in revenue across the same 900 orders without winning a single new customer.
Then treat the gap as a prompt to investigate rather than a verdict:
- Above your industry benchmark. Confirm the definitions match, then check conversion and repeat purchase before treating the basket as a strength. A high AOV bought with low conversion is not a win.
- At the benchmark. Let your own margins and conversion rate decide whether AOV is the lever worth pulling, rather than the panel.
- Below the benchmark. Segment by product category and customer type first, then look at basket composition. Single-item orders, the free-shipping threshold and cross-sell are the usual places to start.
One caution: do not chase AOV in isolation. Pushing it with high minimums or aggressive upsells can suppress conversion, so the order value climbs while total revenue stalls. Across categories, the revenue-per-visitor table above shows how far high order values and low conversion offset each other, and the same trade-off can play out inside one store, so measure revenue per visitor alongside AOV whenever you test a change.
Find the AOV and checkout blockers on your store
What Actually Moves AOV
Three levers are worth testing first, and each has a focused playbook worth more than a paragraph here.
Free shipping thresholds. A threshold set just above where your orders already cluster nudges shoppers to add one more item to qualify. Shopify's guide mentions a rule of thumb of around 30% above your AOV and adds that it is often smarter to anchor it to your most common order size than to the mean. That caveat matters: a smaller group of large orders pulls the mean above what a typical order looks like, so a threshold built on the mean can leave most orders out of reach. The cost side matters as much as the lift, because orders that already reach the threshold stop paying shipping and add nothing. The free shipping threshold guide shows how to set one from your order data, and the free shipping threshold calculator checks the order lift you need to break even.
Cross-sells, upsells and bundles. Showing complementary items, a better version or a discounted bundle raises the basket at the moment of intent. A skincare brand selling a $30 cleanser can offer a matching $25 moisturizer as a routine bundle priced at $50, which grows the order while still reading as a saving. The cross-selling and upselling playbook covers where each tactic fits across the product page, cart and post-purchase.
Volume and tiered incentives. "Buy two, save 10%" and tiered gifts reward larger orders. These tend to work best in replenishment categories like beauty and pet care, where a low base AOV leaves more room to grow the basket. A pet store at a $61 AOV might add a free treat on orders over $75, nudging the replenishment basket up without discounting the core products.
Test one lever at a time. If you launch a threshold, a bundle widget and a volume deal in the same week, a higher AOV tells you nothing about which one earned it. Give each change long enough to cover a full buying cycle and enough orders to read, and check revenue per visitor next to AOV before you keep it.
Pro tip: Fix the leaks before adding upsells. A clean, fast checkout keeps the bigger basket you just built from collapsing at payment. The checkout optimization guide walks through the friction that quietly cancels AOV gains.
AOV Is One Input to Lifetime Value
AOV is a snapshot of a single order. The number that sets a ceiling on what you can spend to acquire a customer is lifetime value, and AOV is only one of its inputs:
CLV = AOV x Purchase Frequency x Customer Lifespan x Profit Margin
The comparison is worth running. A beauty brand at a $79 AOV, four orders a year over three years at a 60% , carries a customer value of roughly $569. A furniture store at a $240 AOV with a single lifetime order at the same margin carries about $144. The lower-AOV business is worth more than three times as much per customer, which is why AOV by itself rarely settles the question.
Before you pour effort into lifting AOV, check where the bigger gap sits. The CLV calculator shows how a change in AOV, frequency or retention flows through to total customer value, and the customer acquisition cost calculator shows what each new customer costs and how fast you earn it back.
Where to Start
Benchmark your AOV against your own vertical, not the cross-industry average, and prefer a stable category figure over a volatile one. Check the desktop and mobile split and your regional mix for differences worth investigating. Then pick one lever, usually a free-shipping threshold or a cross-sell block, and measure revenue per visitor as you test it. If you want a fast read on what is holding your product pages and checkout back, an automated store audit flags the AOV and conversion blockers across your store in one pass.
Frequently Asked Questions
What is a good average order value?
There is no universal number, because AOV depends mostly on your category's unit prices. In Dynamic Yield's September 2026 data, luxury and jewelry stores averaged around $569 while pet care stores averaged around $61. Compare your AOV to other stores in your industry rather than to a single target, and read it next to your conversion rate.
How is average order value calculated?
Divide total revenue by the number of orders for the same period: AOV = Total Revenue / Number of Orders. Platforms differ on what counts as revenue; Shopify's own report uses gross sales minus discounts and leaves returns out. Whichever rule you use, apply it the same way every time so the number stays comparable across periods. A store with $50,000 in revenue across 500 orders has an AOV of $100.
Why does average order value vary so much by industry?
Unit price is the main driver. A category selling $300 items will post a higher AOV than one selling $15 items, however well either store merchandises. Basket composition matters too: furniture orders often bundle big-ticket items, while beauty and grocery orders bundle many low-priced ones. In Dynamic Yield's September 2026 data, higher-AOV categories mostly converted less often, so for most categories revenue per visitor varied far less than AOV did.
How do I increase my average order value?
Three levers are worth testing first: a free-shipping threshold, with 20 to 30% above your current AOV as a common starting point; cross-sells, upsells and bundles at the product page and cart; and volume incentives like "buy two, save 10%" in replenishment categories. Test one at a time and watch revenue per visitor, not just AOV, since aggressive minimums can lift order value while lowering conversion.
How often should I benchmark my AOV?
Review AOV monthly for trends and benchmark against your industry quarterly. Daily numbers swing with order mix, so a 30-day rolling average gives a steadier read. Recalculate after any major change, such as launching a free-shipping threshold or a bundle, to see whether it moved the basket.

Jakub is the founder of Ecomhint, an AI-powered ecommerce audit tool focused on UX and conversion optimization. He helps online stores identify friction points across product pages, cart, and checkout using CRO best practices and original research data.
Jakub is the founder of Ecomhint, an AI-powered ecommerce audit tool focused on UX and conversion optimization. He helps online stores identify friction points across product pages, cart, and checkout using CRO best practices and original research data.
