![Ecommerce Conversion Rate Benchmarks by Industry [2026 Data]](/images/blog/ecommerce-conversion-rate-benchmarks-by-industry-featured.webp)
Ecommerce Conversion Rate Benchmarks by Industry [2026 Data]
Published benchmarks put the typical ecommerce conversion rate between about 1.4% and 2.68%, because each publisher measures a different population in a different way. See 2026 benchmarks from Dynamic Yield, Contentsquare, Littledata and IRP Commerce across 8 industries, 3 devices and 3 regions, with the methodology behind each one.
Across the major published benchmarks, the typical ecommerce sits between roughly 1.4% and 2.68%, and which end you land on depends heavily on who did the counting. That spread is not noise. It comes from publishers measuring different populations over different periods with different definitions, which is why a food and beverage store converting at 3% might be underperforming while a luxury jewelry brand at 1.5% is doing well above its category average.
This guide breaks down ecommerce conversion rate benchmarks by industry, device, traffic source, region and, for Shopify, by platform, so you can compare your store against stores that actually look like yours. Figures come from Dynamic Yield, Contentsquare, IRP Commerce and Littledata, each read directly from the publisher rather than from a roundup. Where publishers disagree, this guide shows the disagreement instead of averaging it away. Statistics for every other part of the store are collected by topic on our ecommerce benchmarks page.
If you run a Shopify store specifically, our Shopify conversion rate optimization guide covers tactical improvements in detail.
Not sure what your conversion rate is? Divide completed orders by total sessions, then multiply by 100. On Shopify, the built-in rate counts sessions that completed checkout rather than orders, and it can look different after Shopify's September 2026 session update. Use the free conversion rate calculator to get your number, then come back to see where you stand.
How to use this guide:
- Calculate your conversion rate and note which denominator you used.
- Match the benchmark's period to yours, comparing the same season rather than your November against someone's rolling year.
- Write down the raw sessions and orders behind your rate. With only a few hundred sessions, the data may not show whether your store meaningfully differs from the benchmark, whatever the percentage says.
- Identify your primary industry benchmark from the table below.
- Compare acquisition and retention channels separately, and split by device and by new versus returning visitors.
- Only then evaluate your blended rate, and if a gap survives all of that, find the stage it lives in before deciding what to fix.
Key ecommerce conversion rate statistics
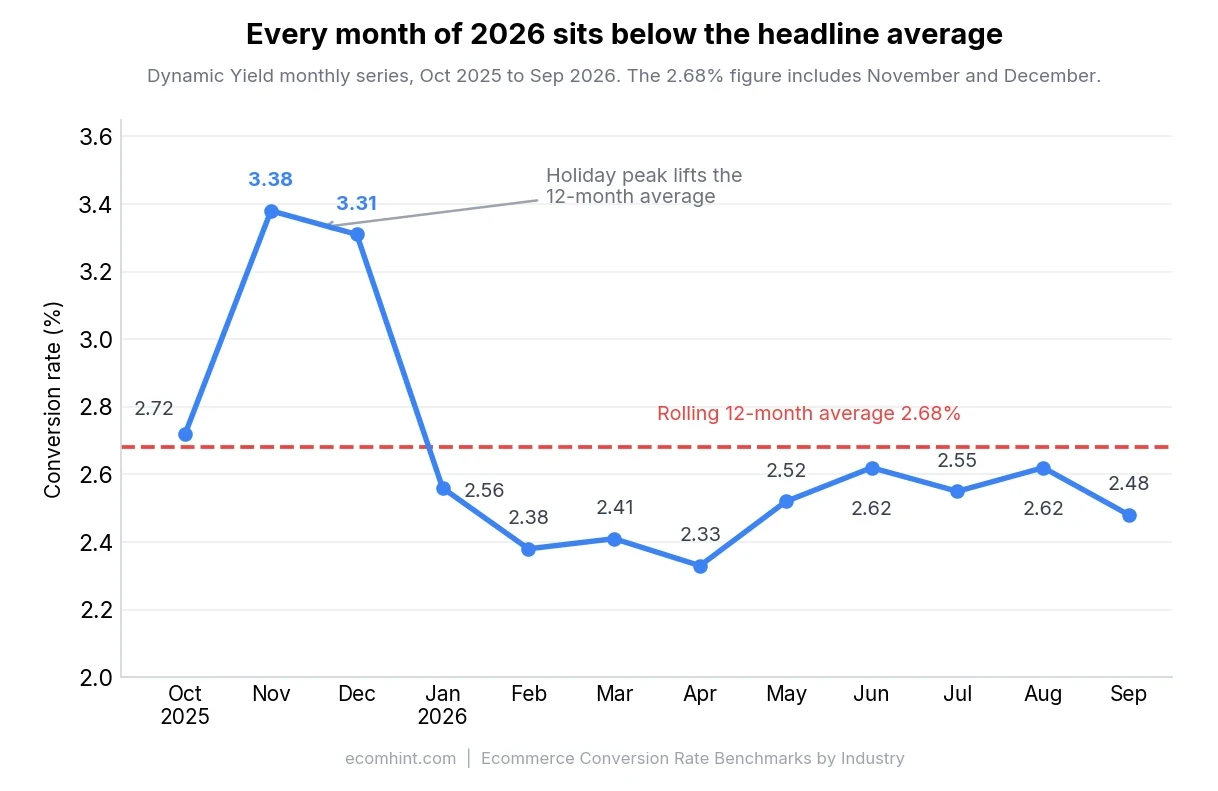
- Dynamic Yield puts the global average at 2.68% over the twelve months to September 2026, but every single month of 2026 sits lower, between 2.33% and 2.62%. The rolling figure is lifted by November 2025 at 3.38% and December at 3.31%.
- Beauty and Personal Care now converts highest at 5.38%, ahead of Pet Care at 4.84%; Luxury and Jewelry is lowest at 0.69% (Dynamic Yield, twelve months to September 2026).
- Dynamic Yield now puts mobile ahead of desktop: mobile 2.86%, tablet 2.78%, desktop 2.23% (twelve months to September 2026).
- Contentsquare's retail cut puts desktop ahead at 3.7% against 2%, while the median store in Littledata's Shopify benchmark converts 1.5% on both devices.
- Mobile carried 75.67% of ecommerce traffic against 23.33% for desktop and 1% for tablet over the twelve months to September 2026 (Dynamic Yield).
- EMEA leads regionally at 2.84%, ahead of the Americas at 2.59% and APAC at 1.46% (Dynamic Yield).
- The median Shopify store converts at 1.4%, with the top 20% above 2.6% and the top 10% above 3.4% (Littledata, 421 stores, June 29 to September 26, 2026).
- IRP Commerce measured conversion up 20.5% year over year to 2.23% in August 2026 while visitors fell 13.7%.
- Contentsquare reports the reverse direction in retail: conversion fell 5.5% year over year, by 8% on desktop and 3.5% on mobile.
- Baymard's average documented is 70.22%, a cart-to-order figure rather than a checkout-completion one.
- AI-referred traffic converted 42% better than non-AI traffic in March 2026, reversing a 38% deficit a year earlier (Adobe, US retail).
What Is a Good Ecommerce Conversion Rate?
A good ecommerce conversion rate depends entirely on your industry, traffic mix, and product type. Calling 3% universally good is misleading, and the bigger problem is that the published averages themselves are not comparable with each other.
Dynamic Yield's cross-industry data puts the global average at 2.68% for the twelve months to September 2026. Worth knowing before you benchmark against it: every month of 2026 in that same series sits lower, between 2.33% in April and 2.62% in June and August. The rolling average is held up by November 2025 at 3.38% and December at 3.31%, the holiday peak. So if you are comparing an ordinary trading month against 2.68%, you are comparing it against a number that includes Black Friday.
Littledata's Shopify benchmark puts the median store at 1.4% of sessions over the 90 days to September 26, 2026.
The gap between those two numbers is not a measurement error. Dynamic Yield divides purchases by users, Littledata divides sessions with a purchase by all sessions, and one person who visits four times before buying is one user and four sessions, so the same purchase produces a much higher rate under Dynamic Yield's definition. The panels and periods differ as well, a rolling twelve months across 400+ brands against 90 days across 421 Shopify stores, and Littledata reports the middle store rather than a panel-wide rate. Neither figure is wrong. Comparing your own number to the wrong one is.
That applies to every source in this guide, so here is what each one actually measures. Find the row that resembles your store before you compare a single percentage.
| Source | Period used here | Panel | Geography | Denominator | Counts as a conversion |
|---|---|---|---|---|---|
| Dynamic Yield | Twelve months to September 2026, rolling | 400+ brands, 200M+ monthly users, 300M+ sessions | Global, split into three regions | Users | Purchase |
| Contentsquare | Q4 2024 vs Q4 2025 | Retail cut of a 6,500+ site, 99bn session panel; retail subset size not disclosed | Global, retail only | Sessions | Purchase |
| IRP Commerce | August 2026, monthly | Independent merchants on the IRP platform | Great Britain, Northern Ireland, Ireland | Sessions | Purchase |
| Littledata | June 29 to September 26, 2026 | 421 Shopify stores that send data to GA4 through Littledata | Not disclosed | Sessions | Purchase |
| Adobe | March 2025 to June 2026 | 1tn+ visits to US retail sites | US | Visits | Purchase |
Three of those columns do most of the damage when people quote these side by side. A user-based rate reads higher than a session-based one on identical traffic. A rolling twelve-month window is not comparable with a single month or quarter. Every row above measures ecommerce purchases. That sounds obvious for a guide about ecommerce conversion, and it is the reason several widely quoted figures appear nowhere in this article: cross-industry panels that count form submissions, and agency benchmarks built on lead generation, are not measuring the thing named in the title.
With that established, a more answerable question than whether a rate is good is where it would sit in a known sample. Littledata's benchmark of 421 Shopify stores publishes a median of 1.4% and percentile cutoffs, which restate as positions:
| Where you sit in Littledata's September 2026 Shopify benchmark | Conversion rate |
|---|---|
| Bottom 20% | Under 0.5% |
| Between the bottom 20% and the median | 0.5% to 1.4% |
| Between the median and the top-20% cutoff | 1.4% to 2.6% |
| Top 20%, up to the top-10% cutoff | 2.6% to 3.4% |
| Top 10% | Above 3.4% |
Those are positions in one 90-day sample of Shopify stores that use Littledata, not universal grades. Littledata counts sessions with a purchase but doesn't say where the stores are, so it tells you the shape of a distribution rather than a market-wide level.
Key takeaway: Compare your rate against your specific industry and traffic profile, not against a universal average. Against Dynamic Yield's user-based panel, 2% sits well above the Luxury and Jewelry average and below the Fashion one, at 2.74%. Even then it is a position, not a diagnosis: Littledata's Shopify benchmark puts the median fashion store at 1.3%, where the same 2% reads as above the middle.
Ecommerce Conversion Rate Benchmarks by Industry
Industry is one of the largest sources of conversion rate variation. In Dynamic Yield's current panel the best-converting category runs nearly eight times the rate of the worst, and the leader has changed: Beauty and Personal Care has overtaken Food and Beverage in the current twelve-month window.
These are Dynamic Yield's figures for the twelve months to September 2026, read from the publisher directly on October 6, 2026:
| Industry | Conversion rate |
|---|---|
| Beauty & Personal Care | 5.38% |
| Pet Care & Veterinary | 4.84% |
| Food & Beverage | 4.56% |
| Multi-Brand Retail | 2.86% |
| Fashion, Accessories & Apparel | 2.74% |
| Consumer Goods | 2.32% |
| Home & Furniture | 1.22% |
| Luxury & Jewelry | 0.69% |
A note on a pair of numbers you will meet elsewhere: 6.22% for Food and Drink and 0.94% for Luxury still circulate across 2026 roundups as current figures, and this article carried them too until September 2026. They came from an earlier position of the same Dynamic Yield rolling window, which moves every month. The live equivalents are 4.56% and 0.69%. A rolling benchmark needs an access date attached to it or it quietly goes stale in place.
For a second opinion from a different panel, IRP Commerce measures sector rates monthly across B2C ecommerce in Great Britain, Northern Ireland and Ireland. Its August 2026 spread runs from Arts and Crafts at 5.81% down to Baby and Child at 0.57%, a wider range than Dynamic Yield's on a much smaller geography.
Why such a range? Three explanations are commonly offered, and this dataset reports the spread rather than isolating what causes it:
- . Lower-priced items (food, beauty) carry less purchase friction. A $15 face cream needs less consideration than a $2,000 sofa, which is why average order value by industry ranges just as widely.
- Purchase frequency. Repeat buyers in pet food or groceries already trust the store and skip the evaluation phase.
- Product tangibility. Items people want to see or try, like furniture and jewelry, generate more browsing sessions that never convert.
See where your store stands against these benchmarks
Conversion Rates by Device: Mobile vs Desktop
Mobile carries roughly 76% of ecommerce traffic, precisely 75.67% against desktop's 23.33% and tablet's 1% over the twelve months to September 2026 in Dynamic Yield's device usage data. What it converts at is now genuinely disputed, and any article giving you one clean number is hiding that.
Dynamic Yield now puts mobile ahead, against the ordering most benchmarks report:
| Device | Conversion rate | Traffic share |
|---|---|---|
| Mobile | 2.86% | ~76% |
| Tablet | 2.78% | ~1% |
| Desktop | 2.23% | ~23% |
Other benchmarks measuring ecommerce purchases don't agree. Contentsquare's retail benchmark has desktop at 3.7% against mobile at 2% for retail specifically, the opposite of Dynamic Yield's ordering. Littledata's Shopify benchmark sits between them: its median store converts 1.5% on mobile and 1.5% on desktop (these are medians of different store groups, so the overall median of 1.4% can sit below both). Three ecommerce panels, three different answers.

So which is it? Nobody has published enough to say, and the denominators are the first thing to check: Dynamic Yield divides purchases by users, while Contentsquare's retail figures and Littledata's are session-based. A user-based count flatters whichever device carries more repeat visits, and mobile carries most of them. Beyond that, the panels, periods, goal configuration and device classification all differ, leaving room for the orderings to diverge without either side being wrong.
One popular explanation deserves retiring, because it circulates widely and the data does not support it. Dynamic Yield reports that 82% of returning visitors arrive on mobile, which sounds like a repeat-heavy panel inflating the mobile rate. But mobile is already 75.67% of all traffic in that same dataset, so returning visitors skew mobile by only about six points, and Dynamic Yield publishes no return rates by device at all. The figure is real; the mechanism built on it is not.
The practical reading: do not benchmark your own mobile gap against any one of these numbers in isolation. None of the panels resolves into a rule for one store, so the useful comparison is your own mobile-versus-desktop split measured over time.
Where a mobile gap is large enough to matter at your volume and holds across comparable traffic, split it before treating it as a mobile problem: by funnel stage, by source, by browser, and by new versus returning visitors. A gap living entirely in one paid campaign is a traffic problem, not a device one. Once it survives that split, test the usual suspects in order, starting with slow page load times, difficult form inputs, payment errors, and missing options. Our checkout optimization guide covers these in detail, and mobile checkout best practices goes deeper on form design and express payments.
Conversion Rates by Traffic Source
Where visitors come from affects how likely they are to buy. Someone clicking a cart recovery email is already partway through a purchase. A visitor from a TikTok video might be casually browsing.
Here is the honest state of this question: none of the market panels in this guide publish conversion by channel. Dynamic Yield, Contentsquare, Littledata and IRP Commerce all measure ecommerce conversion; not one breaks it out by traffic source. The tables that circulate under that heading, including the one this article carried until September 2026, come from agency books of business weighted toward lead generation in SaaS, real estate and financial services, where a conversion is a form submission rather than a purchase.
One agency dataset is more transparent than most. ConversionTeam publishes channel medians from 1,055 audited A/B tests across 71 client engagements, with the test and client count stated for every cut. Its ecommerce channel figures run far above every panel above, email at 11.8% against direct at 5.9% and at 3.0%, and the reason is in its own methodology: the baseline is the control's rate on each test's primary metric, which is not necessarily a purchase, and it warns that its segment cuts come from a narrower, higher-traffic subset. Useful for ranking channels against each other, not for judging your own rate.
Which leaves channel conversion as a metric you can mostly only benchmark against yourself. The comparison that matters is your own email against your own paid search, over the same period, in the same analytics setup.
Three things are worth knowing before you run it. Email usually leads, and its average hides a wide spread, because cart abandonment emails reach shoppers who already added items to a cart while a newsletter reaches everybody. Organic search varies by intent within itself, since someone searching "buy running shoes size 10" converts at a much higher rate than someone searching "best running shoes 2026." And stores leaning heavily on social traffic typically need stronger homepage trust signals to close the gap between a feed and a checkout.
Why Channel Mix Matters More Than Blended CVR
An anonymized example from our own audit data: a mid-price B2C niche retailer in Europe, twelve months across roughly 240,000 sessions.
| Channel | Traffic Share | CVR |
|---|---|---|
| Direct | 12% | 5.79% |
| 2% | 3.21% | |
| Organic Search | 60% | 2.86% |
| Paid Search | 20% | 2.86% |
Those four channels cover 94% of sessions, with the remaining 6% spread across referral, social and smaller sources. Blended across all traffic, the store converted at 3.29%.
That 3.29% sits above several mid-market benchmarks, including consumer goods at 2.32% in the Dynamic Yield table above, which looks like a straightforward win. The channel breakdown shows where the number actually comes from. Direct converted at roughly twice the rate of the two search channels despite being only 12% of sessions, and it lifted the blended rate well above them. It did not carry it: direct contributes about a fifth of conversions, organic search about half. Organic and paid search, which drove 80% of traffic, both converted at 2.86%, below the store's own blended figure and only about half a point above the 2.32% category benchmark. The revenue split was more skewed still: direct produced roughly 26% of revenue from 12% of sessions, while paid search produced 10% of revenue from 20% of traffic.
Direct deserves a caveat of its own. It is an attribution bucket, not a customer type, collecting loyal repeat visitors alongside untagged links, stripped parameters and anything else analytics cannot attribute. Confirm the loyalty reading against a separate new-versus-returning report before acting on it.
Key takeaway: A single blended conversion rate can mask the contribution of individual channels. Benchmark each channel separately to see whether your overall rate reflects strong performance across the board, or a small high-converting segment carrying the rest.
Conversion Rates by Region
Regional averages differ widely, and the usual explanations reach for ecommerce maturity, payment preferences and shipping infrastructure. Keep that in the category of plausible reading rather than measured finding, for a reason the table makes clear.
These come straight from Dynamic Yield for the twelve months to September 2026. Regional bands circulating elsewhere tend to run higher because they travel through intermediaries.
| Region | Avg. conversion rate |
|---|---|
| EMEA (Europe, Middle East, Africa) | 2.84% |
| Americas | 2.59% |
| APAC (Asia-Pacific) | 1.46% |
EMEA now leads, narrowly. That reverses the ordering most benchmark articles still repeat, and the gap between EMEA and the Americas is about a quarter of a point, well inside the range these panels drift month to month.
APAC at 1.46% sits far below both, and that distance is the real story here. What the table cannot tell you is why. Dynamic Yield publishes only the regional aggregates, not the country composition behind them, so any account of which markets pull APAC down would be guesswork dressed as analysis. Treat these as panel-level context and compare your own store against its actual country, payment, shipping and device mix.
Shopify Conversion Rate Benchmarks
Shopify publishes no platform conversion figures of its own, so Littledata's September 2026 benchmark is the only source here, and its positions appear in the table earlier in this guide.
The useful part is the shape rather than the level. The top-10% cutoff is about 2.4 times the median, smaller than the 7.8x between Dynamic Yield's best and worst categories but sitting inside a single platform. Stores selling much the same things land across that whole range. And the spread survives inside a category: Littledata's Home and Furniture cut has a median of 0.8%, with the top 20% above 1.8% and the top 10% above 2.4%, a 3x gap, wider than the 2.4x across all stores. Whatever separates a median store from a top-decile one, selling the same things does not close it.
A separate EcomHint audit of 190 small US-focused Shopify stores offers one view of what varies. Trust and content checks failed far more often than ones, with around 61% of stores failing basic trust checks, and the homepage failed more often than the product page. That audit measured whether page elements were present and well implemented, not what they did to conversion, so read it as a map of what is commonly missing rather than as the reason any store converts low.
If your Shopify store sits below the 1.4% median on a comparable measurement, that is a position in one 90-day distribution rather than a verdict, and the band itself does not tell you what to fix. The funnel stage does. A low view-to-cart rate points at the offer or the product page; a low cart-to-checkout rate points at costs or clarity in the cart; a low points at payment, forms or trust. Our Shopify CRO guide walks through diagnosing each of those in turn.
See how your store's conversion rate compares
Year-over-Year Conversion Rate Trends
An earlier version of this section carried a 2020 to 2025 table sourced to an aggregator that named no underlying research. We removed it. What follows is only what the original publishers measured.
Digital Commerce 360's Ecommerce Conversion Report, covering its Top 1000 retailers, reports median conversion of 2.8% in 2021, 2.8% in 2022 and 2.7% in 2023. Direct marketers ran higher throughout, sliding from 4.1% to 3.7% across those three years, and retail chains from 3.2% to 2.9%. The report has no 2024 or later data.
For the recent end of the series, IRP Commerce publishes monthly market data. Its August 2026 reading is the one worth sitting with:
| Metric | Aug 2025 | Aug 2026 | Change |
|---|---|---|---|
| Conversion rate | 1.85% | 2.23% | +20.5% |
| Visitors (indexed) | 100 | 86.3 | -13.7% |
| Revenue per session | £1.54 | £1.92 | +24.7% |
In IRP's panel, conversion rose while traffic fell. That combination is easy to misread as stores getting better at selling, and the data does not say that. IRP publishes the figures without identifying a cause, and channel mix, seasonality, merchant composition, promotional calendars and traffic quality could each contribute. A widely offered explanation is that AI search and answer engines now absorb the low-intent browsing that used to land on product pages and never convert, leaving a smaller and more qualified stream, but that is a hypothesis about the pattern rather than something IRP measured.
Contentsquare's retail benchmark shows the opposite pattern over an earlier window, Q4 2024 against Q4 2025: retail conversion fell 5.5% year over year, by 8% on desktop and 3.5% on mobile, with new visitors down 8.9% and returning visitors down 4%. Two panels, opposite directions, both measuring ecommerce purchases, and eight months apart. Which is its own reminder that the period matters as much as the number.
The caution that matters applies to the IRP reading. A rising conversion rate is not automatically good news, because it can also mean the top of the funnel is being cut off while the bottom holds.
How Does AI Traffic Convert?
AI referral traffic is the fastest-moving number in ecommerce benchmarking right now, recent enough that most benchmark articles have no entry for it.
Adobe, measuring more than a trillion visits to US retail sites, has tracked a full reversal across roughly fifteen months. Each row comes from the Adobe release that reported that period:
| Period | AI traffic vs non-AI traffic | Adobe release |
|---|---|---|
| March 2025 | converted 38% worse | April 2026 |
| Prime Day 2025 | converted 23% worse | June 2026 |
| Holiday 2025 (Nov to Dec) | converted 31% better | January 2026 |
| March 2026 | converted 42% better | April 2026 |
| Prime Day 2026 (23 to 26 June) | converted 40% better | June 2026 |
The engagement figures point the same way. Over the 2025 holiday season Adobe recorded AI-referred shoppers spending 45% more , viewing 13% more and being 33% less likely to bounce immediately. Contentsquare's retail benchmark describes the same behaviour from the other direction, finding that AI-influenced shoppers arrive better informed and reach a purchase in two fewer pages than shoppers from other sources.
Every one of those figures is relative, and that is the trap. Adobe is comparing AI traffic against a store's other traffic, not stating what AI traffic converts at. Two ecommerce vendors do publish absolute rates, and they disagree by a factor of two. ThoughtMetric tracked hundreds of stores and puts AI search at 1.81% for Q1 2026 against 1.01% for organic. Lebesgue, working across more than 35,000 Shopify sellers, puts AI referrals at 3.6% against 1.23% for Google search. Neither discloses its denominator or what it counts as a conversion, and a 2x gap between two ecommerce samples measuring the same channel in the same year tells you how young this measurement still is. Both agree on direction; neither is a market benchmark yet.
The practical version: AI referrals look worth more per visit than their volume suggests, and the volume is growing fast. But if someone quotes you "AI traffic converts 40% better" as though it were an absolute conversion rate, they have misread a relative comparison.
How to Improve Your Ecommerce Conversion Rate
If your conversion rate falls below your industry benchmark and survives the comparability checks above, these are the areas that typically have the largest impact.
Reduce checkout friction
Cart and checkout abandonment together account for a large share of lost orders, and it helps to keep the two stages apart. Baymard Institute's research puts the average documented cart at 70.22%, measured from carts created to orders placed. Many of those shoppers never reach checkout at all, so that figure describes the whole cart-to-order journey rather than the completion rate of checkout itself. The top reasons include unexpected costs, required account creation, and complicated checkout flows.
Specific fixes: offer guest checkout, show shipping costs early, reduce form fields to the minimum, and add express payment options. Our checkout optimization guide covers each in depth, and cart abandonment recovery handles the follow-up.
Improve product pages
Product pages are where most buying decisions happen. High-quality images with multiple angles and zoom, clear pricing, visible stock status, and genuine customer reviews all affect whether a visitor adds to cart. Our online review statistics quantify how much weight reviews carry in that decision.
Speed up your site
Page can affect how far visitors get through the . In Deloitte's 2020 study, commissioned by Google, of 37 brands and more than 30 million mobile sessions, a 0.1-second improvement in mobile speed was associated with around 8.4% more retail conversions. That 0.1 seconds was the combined effect of four speed metrics, and the study observed natural speed changes rather than testing them, so treat it as the value of a consistent speed program rather than one quick fix.
Compress images and cut first, since those are where most stores lose time. Check what your platform already does before adding anything: Shopify serves theme assets through its own Cloudflare-backed with automatic and compression, so the work there is removing or deferring app scripts rather than bolting on another layer. On WooCommerce, a CDN is worth considering once images and scripts are in order.
Build trust above the fold
First-time visitors decide within seconds whether to stay or leave. Trust signals on your homepage, including reviews, , clear return policies, and real contact information, reduce the perceived risk of buying from an unfamiliar store.
Segment and personalize
Treating every visitor the same leaves money on the table. An email subscriber who already bought twice needs a different experience than a first-time visitor from Instagram. Personalization based on traffic source, browsing history and purchase behavior can improve conversion in segments large and well-defined enough to act on. Test it against a control, and fix clear funnel leaks first, because a wrong inference or a hidden option can cost more than the personalization gains.
FAQ
What is the average ecommerce conversion rate in 2026?
It depends on who is counting. Dynamic Yield reports 2.68% for the twelve months to September 2026, dividing conversions by users. Littledata's median Shopify store converts 1.4% of sessions. IRP Commerce measured 2.23% in August 2026. The spread reflects how each one measures rather than disagreement about the market, and no publisher quantifies how the gap splits between denominator, panel and period.
What is a good conversion rate for Shopify?
Littledata's benchmark of 421 Shopify stores puts the median at 1.4%, with the top 20% above 2.6% and the top 10% above 3.4%. The data covers the 90 days to September 26, 2026 and counts sessions with a purchase, but Littledata doesn't say where the stores are, so read it as the shape of a distribution rather than a market-wide level. If your store sits below 1.4% on a comparable measurement, find the leaking funnel stage before choosing a fix.
Why is my conversion rate lower than the industry average?
First check you are comparing like with like: the same period, the same denominator, and a panel that resembles your store. If a gap survives that, common causes include slow page load times, missing , complicated checkout flows, limited payment options and poor mobile experience. A shift toward lower-intent acquisition traffic can also pull a blended rate down, though channel labels alone do not predict the result. Run a free store audit to identify specific areas for improvement.
How often do ecommerce conversion rates change?
Conversion rates fluctuate seasonally, with Q4 typically showing higher rates due to increased purchase intent. They also shift with broader economic conditions, technology changes such as new payment methods, and competitive dynamics. Benchmarking quarterly gives a more accurate picture than looking at a single month.
Does mobile convert worse than desktop?
The major benchmarks now disagree. Dynamic Yield puts mobile ahead at 2.86% against desktop 2.23%, while Contentsquare's retail benchmark has desktop at 3.7% against mobile at 2%, and the median store in Littledata's Shopify benchmark converts 1.5% on both. Dynamic Yield divides by users while Contentsquare and Littledata count sessions, and their panels, periods and device classification differ too. No publisher isolates which of those drives the split. Measure your own split rather than adopting any one figure.

Jakub is the founder of Ecomhint, an AI-powered ecommerce audit tool focused on UX and conversion optimization. He helps online stores identify friction points across product pages, cart, and checkout using CRO best practices and original research data.
Jakub is the founder of Ecomhint, an AI-powered ecommerce audit tool focused on UX and conversion optimization. He helps online stores identify friction points across product pages, cart, and checkout using CRO best practices and original research data.
