Ecommerce Website Speed Statistics 2026: 100+ Figures on Load Time and Core Web Vitals
How fast online stores load in 2026, how speed relates to conversions and bounce, what shoppers expect and what slows stores down: 100+ ecommerce speed figures, each with its publisher and year, and the sample where the source gives it.
The latest ecommerce website speed statistics show a wide gap between store platforms. In September 2026, around 85.5% of US Shopify origins (website addresses) had good mobile Core Web Vitals, against about 54.7% of US WooCommerce origins (HTTP Archive). Speed also tracks sales. Conversion ran about 3.5% lower for every 100 ms of slower LCP across stores in Shopify's April 2026 analysis, a correlation. The few controlled tests that publish a 100 ms result sit near 1% or lower.
This page covers how fast online stores load, what counts as fast, how speed relates to conversions, bounce and what shoppers say they do, and what slows stores down. The figures are grouped by question, and each comes with its publisher and year, plus the sample and type of evidence where the source gives them. Online stores come first, and general web figures are labeled as context. "Abandonment" here means leaving while a page loads, which is a different thing from cart abandonment.
Key ecommerce website speed statistics
- Around 85.5% of US Shopify origins had good mobile Core Web Vitals in September 2026, in HTTP Archive's Technology Report, from Chrome field data.
- US WooCommerce origins sat at around 54.7% on the same measure (HTTP Archive, September 2026).
- Around 55.9% of 18,376,044 origins had good Core Web Vitals in September 2026, all sites included, per Google's Chrome UX Report.
- Around 81% of 1,533 Shopify stores with Chrome field data pass Core Web Vitals on mobile, in EcomHint's 2026 Shopify Speed Benchmark.
- About 1% of those stores pass mobile LCP in the lab, against about 91% with real visitors, in the same 2026 benchmark.
- Conversion tends to run about 3.5% lower for every 100 ms of slower LCP, a correlation across actively selling stores in Shopify's April 2026 analysis.
- A 10% slower site went with about 4.2% lower sales, a figure one author gave in a summary for Wharton of a peer-reviewed 2023 paper by Gallino and colleagues that used natural variation.
- A 0.1-second mobile gain went with about 8.4% more retail conversions, a correlation in Deloitte's 2020 study for Google.
- A 100 ms delay went with up to 7% lower mobile conversion in Akamai's 2017 retail data, also a correlation.
- A 100 ms improvement gave about 0.7% more revenue per session in Zalando's 2018 A/B test.
- A 31% better LCP went with about 8% more sales in Vodafone's 2021 A/B test on a landing page.
- Ecommerce conversion ran near 3.05% at 1 second and 0.67% at 4 seconds, with a rebound at slower speeds, per Portent's 2022 correlation across 6 B2C sites.
- About 53% of mobile visits are abandoned past 3 seconds, from Google's 2016 report on data for about 3,700 mobile sites, a general web figure (Google).
- Abandonment before first paint runs about 14.4% on Android at 3 seconds, a general web figure from Chrome field data published in 2020.
- Ecommerce pages loading within 2 seconds averaged about a 9% , and pages at 5 seconds about 38%, in Pingdom's 2018 real-user sample.
- About 52% of 1,250 US adults said they leave a page by the 6-second mark, stated behavior from Digital.com's January 2022 survey.
- Around 45.4% of 525 US consumers say a slow store makes them less likely to buy, also stated behavior, in Unbounce's 2018 survey.
- Median mobile Lighthouse scores fall from 74 with 0-5 third-party services to 30 with 51 or more, across the 1,533 stores in EcomHint's 2026 benchmark, a correlation.
Statistics on other parts of the store sit in the ecommerce stats hub. The table at the end gives the method and sample of the main studies.
How fast online stores load today
Wix eCommerce and Shopify lead on good mobile Core Web Vitals, while Magento and WooCommerce trail, in Chrome field data by platform from HTTP Archive's Technology Report. Each share is good origins divided by tested origins, calculated from the report's raw counts, and the US column uses the report's US filter.
| Platform (mobile, Sept 2026) | Good CWV, worldwide | Good CWV, US |
|---|---|---|
| Wix eCommerce | 79.5% | 87.8% |
| Shopify | 76.2% | 85.5% |
| Squarespace Commerce | 71.0% | 82.9% |
| BigCommerce | 62.5% | 72.3% |
| PrestaShop | 61.4% | 54.5% |
| Magento | 44.6% | 49.0% |
| WooCommerce | 39.3% | 54.7% |
| All sites | 52.8% | 63.3% |
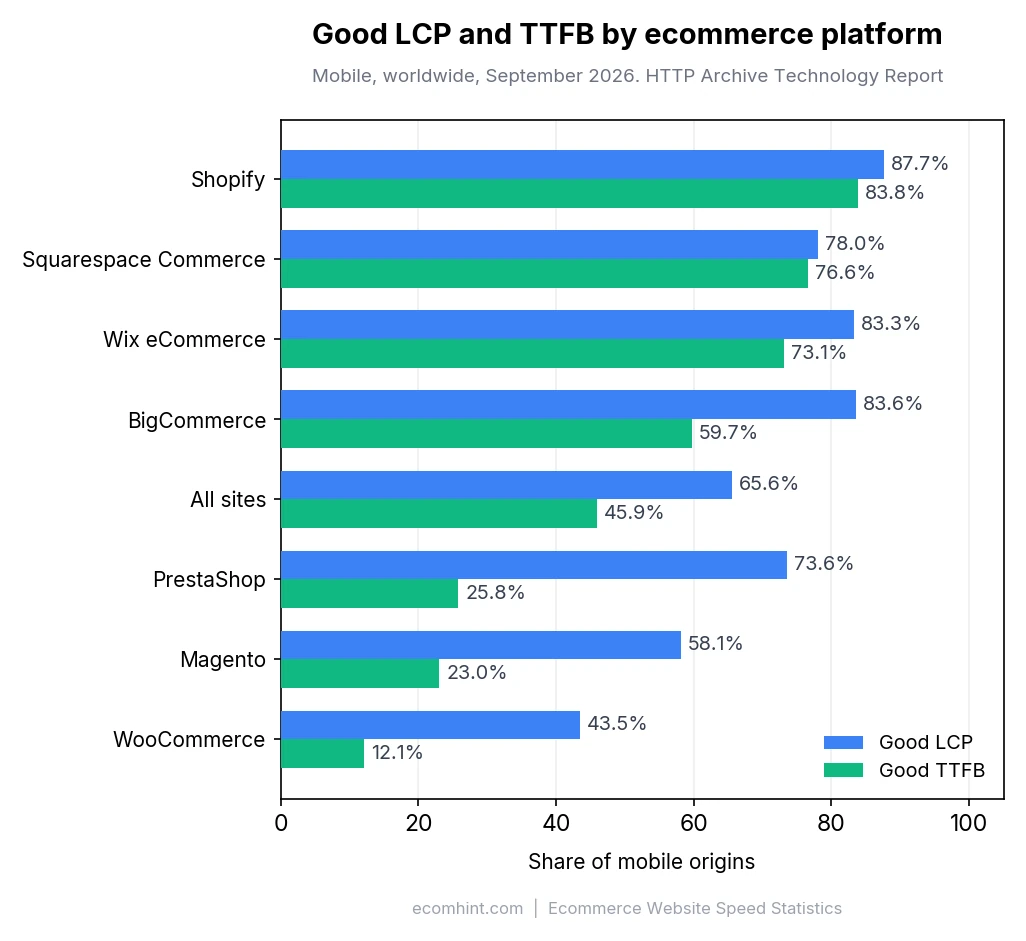
These shares reflect who runs each platform as well as the software. A platform's mix of store sizes and traffic shapes its result. The bases differ too, with 445,297 mobile origins for Shopify and 11,660 for BigCommerce, and PrestaShop's US figure rests on only 836. "Squarespace Commerce" covers nearly every Squarespace site (89,036 of 89,052 origins), so it includes sites that aren't stores.
Good shows the widest split, at about 83.8% on Shopify, 23.0% on Magento and 12.1% on WooCommerce, against 45.9% for all sites (HTTP Archive). Good LCP on mobile runs about 87.7%, 58.1% and 43.5% on the same three platforms. "LCP is the biggest differentiator" in the Web Almanac 2025, with good mobile LCP at about 86% for Shopify, 52% for Magento and 39% for WooCommerce.
Responsiveness looks different. Good INP on mobile is about 91.4% on WooCommerce and 86.7% on Shopify, so on these numbers WooCommerce's shortfall is about loading, and the WooCommerce speed guide starts its fixes with hosting.
Wix eCommerce gained about 10 points in a year, while Shopify stayed flat. Between September 2025 and September 2026, Wix eCommerce rose from about 69.4% to 79.5% on mobile worldwide, WooCommerce rose from about 35.6% to 39.3%, and Shopify held at about 76.2% (HTTP Archive). WooCommerce's tested mobile origins fell from 625,862 to 542,541, so part of its rise could be a changed set of sites (our reading).
Vendor panels of retail sites give a second view. Fewer than 50% of retail sites passed Core Web Vitals in September 2025, across the 700+ larger brands in Yottaa's panel. Good LCP ran about 69% in home goods, 68% in consumer electronics, 66% in health and beauty, 64% in fashion, 63% in grocery and 60% in luxury in Contentsquare's 2022 benchmark, also vendor data.
Across all sites, about 68.3% of origins had good LCP, 81.7% good and 85.4% good INP in September 2026, per Google's release notes. The overall pass rate is up from about 45.6% in the February 2024 dataset, the release in which INP replaced FID. INP has been slipping on the general web, from about 87.2% in February and March 2026 to 85.3% in August, and Google writes that "we don't have a definitive reason for this." Keep the 55.9% and the table's 52.8% apart, because one covers all devices and the other only mobile.
What 1,533 Shopify stores show
About 81% of 1,533 Shopify stores pass Core Web Vitals on mobile and about 77% on desktop in EcomHint's Shopify Speed Benchmark, from about 28,000 PageSpeed Insights tests in March 2026. The benchmark screened 2,332 Shopify stores in 9 industries and kept those with Chrome field data plus mobile and desktop lab data. Stores need enough Chrome traffic to appear, so the smallest stores are missing. The mobile figure sits between HTTP Archive's 76.2% worldwide and 85.5% US for Shopify, from a different month and a store-filtered sample.
The mobile pass rate differs by about 19 points across these industries, from about 92% in Automotive Parts to 73% in Beauty & Personal Care (our subtraction).
| Industry (stores) | Pass CWV, mobile | Pass CWV, desktop |
|---|---|---|
| Automotive Parts (164) | 92% | 82% |
| Fashion & Apparel (177) | 85% | 81% |
| Food & Beverage (141) | 85% | 77% |
| Pet Care (170) | 84% | 81% |
| Home & Furniture (173) | 80% | 84% |
| Multi-Brand Retail (137) | 80% | 69% |
| Consumer Goods (225) | 77% | 80% |
| Luxury & Jewelry (166) | 75% | 72% |
| Beauty & Personal Care (180) | 73% | 68% |
Median 75th-percentile LCP on mobile runs from about 1,322 ms in Automotive Parts to 1,896 ms in Beauty & Personal Care. INP runs from about 88 ms to 137 ms over the same two industries. Even Beauty & Personal Care's median LCP and INP sit inside Google's thresholds.
Lab scores and real visitors disagree
A poor Lighthouse score doesn't necessarily mean a store fails Core Web Vitals for real visitors. On mobile, about 1% of the 1,533 stores pass LCP in the lab and about 91% in the field. On desktop the gap narrows to about 68% and 94%. CLS barely splits on mobile (about 88% and 91%), and it reverses on desktop (about 87% and 82%). The mobile lab test simulates a Moto G Power on throttled 4G, while field data covers real visits to the whole store.
The median mobile Lighthouse score across those stores is about 47. Product pages score about 44 on mobile and 64 on desktop, and collection pages 49 and 65, a gap the product page speed analysis breaks down.
Median mobile scores run about 64 for Wix eCommerce, 55 for Shopify, 43 for OpenCart, 38 for WooCommerce, 36 for PrestaShop, 34 for Magento and 30 for Squarespace Commerce in the Web Almanac 2025. In the same chapter, Squarespace Commerce scores about 30 while around 69% of its origins pass Core Web Vitals on mobile. Use Lighthouse to compare pages under identical conditions, and field data to see what shoppers get.
Average load times by measure
The sources read for this article give no single current average load time for stores. Each figure measures a different moment of the load on a different set of sites.
| Figure | What it measures | Source |
|---|---|---|
| 4.65 s desktop, 7.77 s mobile | Median onLoad, general web lab tests, Oct 2026 | HTTP Archive |
| 1.97 s desktop, 3.26 s mobile | Median First Contentful Paint, same tests | HTTP Archive |
| 1.9 s mobile, 1.7 s desktop, 2.3 s tablet | 75th-percentile LCP, average US site, field data | DebugBear |
| 2.5 s desktop, 8.6 s mobile | Average load, top 100 websites worldwide | Tooltester |
| 1.08 s | Average load, 20 most-visited US websites | Blogging Wizard |
| 1.96 s | Average load, 10 most-visited US retail sites | Blogging Wizard |
| 10.3 s desktop, 27.3 s mobile | Average fully loaded time, 5.2 million pages, 2019 | Backlinko |
| 6.3 s | Speed Index, US retail, 2018, 4G | |
| About 15 s | Full load, mobile ad landing pages, 2018 |
The top-site rows are one-time lab tests of very large sites, so they aren't a benchmark for a typical store. Tooltester's page is dated 2024 and gives no test date. Blogging Wizard ran its own tests and gives no test date, on a page updated in February 2026. Backlinko's 2019 averages come from HTTP Archive lab data and measure fully loaded time, a different metric from onLoad. Google's 6.3 seconds, from its January 2018 mobile benchmarks on 11 million landing pages over 4G, is a Speed Index, which measures how fast content visually fills in. The 15 seconds on the same page is a full load averaged across all 11 million mobile ad landing pages, not retail alone.
About 86% of pages on 6 B2C sites loaded in 5 seconds or less in Portent's 2022 study, up from 81% in 2019, though the study doesn't name the load metric.
See how your Shopify store compares with 1,533 others
What counts as fast
Google's current loading target is an LCP of 2.5 seconds or less, which measures when the main content appears rather than a full load. Core Web Vitals are assessed at the 75th percentile of page loads, separately for mobile and desktop. These thresholds are definitions, so they say nothing about how stores perform.
| Metric | Good | Poor |
|---|---|---|
| LCP | 2.5 s or less | Over 4 s |
| INP | 200 ms or less | Over 500 ms |
| CLS | 0.1 or less | Over 0.25 |
| TTFB | 0.8 s or less | Over 1.8 s |
| FCP | 1.8 s or less | Over 3 s |
LCP, INP and CLS are the three Core Web Vitals. TTFB isn't one, and neither is FCP. INP replaced First Input Delay on March 12, 2024, so FID's old 100 ms target no longer applies, and support for it ended on September 9, 2024.
TTFB causes the most confusion, because Google's live pages carry four numbers from different eras. Current field guidance is 0.8 seconds. A Lighthouse audit uses 600 ms, a legacy PageSpeed rule says 200 ms, and a 2018 benchmark chart lists 1.3 seconds. Use 0.8 seconds when you read field data.
Google's 2018 "under 3 seconds" is a Speed Index target rather than a load time. Its January 2018 mobile benchmarks set "Best Practice: Under 3 seconds" for Speed Index, the same measure behind the 6.3-second US retail average above. Google's current loading target is the 2.5-second LCP.
A delay of 0.1 second feels instant, 1 second keeps the flow of thought, and 10 seconds is the limit of focused attention, in Jakob Nielsen's 1993 limits. That is usability guidance, with no measurement of shoppers behind it.
A Lighthouse speed score of 90 to 100 counts as Good, 50 to 89 as Needs Improvement and 0 to 49 as Poor, in Lighthouse's own labels. By those labels the median across EcomHint's 1,533 Shopify stores, about 47 on mobile, counts as Poor, so peer bands answer a different question. In EcomHint's benchmark, a mobile score above 60 is top quartile in most industries, 50 to 60 is above average, 40 to 50 is typical, and below 40 is bottom quartile. On desktop those bands are above 80, 65 to 80, 55 to 65 and below 55. They shift by industry. The site speed guide covers how to reach these targets.
How site speed affects conversions and revenue
Slower stores tend to convert less in every large retail dataset here, but most of that evidence compares faster and slower sessions or stores rather than testing a change. Many of those datasets come from companies that sell speed tools. Faster sessions also tend to come from better devices and connections, which can inflate the gaps (our reading).
Every 100 ms of slower LCP went with about 3.5% lower median conversion across actively selling Shopify stores, over 28 days around the turn of January and February 2026 (Shopify). Shopify calls it "a clear correlation between performance and conversion, though not direct causation." It excluded the slowest 5% of stores, gives no store count, and sells the platform. Mature stores see roughly a third of the percentage impact that smaller stores see, the only split by store size in the sources read here.
A 10% slower site went with about 4.2% lower sales and 2% lower conversion, figures one author gave in a summary for Wharton of a peer-reviewed paper by Gallino, Karacaoglu and Moreno (Operations Research, Vol. 71, No. 3), the strongest independent evidence here. The average page there loaded in about 3 seconds, so 10% is about 0.3 seconds (our calculation). The authors used natural swings in speed against retailers' transaction data, so the study isn't randomized.
What 100 ms is worth
The few controlled reports that publish a 100 ms figure sit at about 1% or lower, while the correlations range far wider, up to 8.4% at Deloitte. Metrics, sites and decades differ, so treat the table as a rough comparison.
| Change per 100 ms | Design | Source |
|---|---|---|
| 0.5% add to cart, search pages | Method not stated | eBay, 2019 |
| 0.6% revenue | Controlled, not a store | Bing, 2014 |
| 0.7% revenue per session | A/B test | Zalando, 2018 |
| 1% sales | A/B tests | Amazon, 2006 |
| Up to 1% revenue | Method not stated | Walmart, 2012 |
| 1.3% conversion | Correlation | Farfetch |
| 2.4% desktop, up to 7% mobile | Correlation | Akamai, 2017 |
| 3.5% conversion | Correlation | Shopify, 2026 |
| 8.4% retail conversions | Correlation, 4 metrics | Deloitte, 2020 |
About 1% of sales per 100 ms comes from Amazon A/B tests that delayed pages, which Greg Linden reported in a Stanford talk in November 2006 (slide "+100 ms -1% sales") and on his blog. A 2014 paper by Kohavi and colleagues restates it next to Bing's 0.6%, which comes from a search engine rather than a store. Zalando ran its A/B test after a correlation analysis, while the eBay page and Walmart's deck don't say how their per-100 ms figures were derived.
Up to 7% lower mobile conversion per 100 ms delay, and about 2.4% on desktop, comes from Akamai's 2017 real-user data (Akamai's Italian-language blog; summary by Ari Weil). That 7% describes a slope near the conversion peak: the same data gives more than 20%, not 70%, for a full second (our reading). Quote it with the device and the 100 ms, because Aberdeen's 2008 figure is also 7%, for a full second.
At the top of the range, a 0.1-second gain across four speed metrics at once went with about 8.4% more retail conversions in Deloitte's Milliseconds Make Millions, commissioned by Google with data from Fifty-Five. The report keeps only statistically significant results, and observations with "minimal or zero effect" were "not included", which likely lifts the averages (our reading). Rakuten 24 and Ray-Ban, in the case studies below, report far larger lifts from tests that give no per-100 ms figure.
What one second costs
Estimates of what one second costs in conversion range from about 2% to roughly 30%, and none of them reports a controlled test. Stores at a 2.5-second LCP reported roughly 30% lower conversion than stores at 1.5 seconds in Shopify's analysis. One second went with "more than 20 percent" lower conversion in Akamai's 2017 retail data (Weil's summary). Google's 2019 line that one mobile second can affect conversions by up to 20% cites the same dataset, so it isn't a second source.
About 3% more mobile conversions for one second less load time is the vendor estimate in Yottaa's January 2025 index. Its 2022 standard gave about 5.9% on mobile and 5.6% on desktop. Yottaa's own estimate for one second fell by about half between 2022 and 2025, on different samples, and Yottaa sells third-party script control.
A roughly 27% higher conversion rate compares about 1.9% at 2.4 seconds with 1.5% at 3.3 seconds, on one retail site's mobile pages in SOASTA's 2015 data (archived copy), a comparison of visitor groups rather than a test. In Portent's 2019 edition (archived copy), website conversion rates, not store sales alone, fell about 4.42% per extra second over seconds 0 to 5, and 2.11% over seconds 0 to 9.
One extra second of load time "can impact" conversions by 7%, page views by 11% and satisfaction by 16%, per an Aberdeen Group report part-sponsored by Gomez, released in December 2008 and based on more than 160 organizations. The release doesn't say how the 7% was calculated, so read it as a figure across organizations rather than a measured store result.
The well-known $2.5 million applies that 7% to a hypothetical store making $100,000 a day ($100,000 × 7% × 365 is about $2.55 million, our calculation). It appears as an illustration in a 2010 Fortune column by Gomez's CTO and in a 2011 Kissmetrics infographic.
Conversion rate at each load time
Conversion falls fastest over the first few seconds, then flattens or turns back up in several datasets. Ecommerce conversion runs about 3.05% at 1 second, 1.68% at 2, 1.12% at 3 and 0.67% at 4 in Portent's 2022 chart, from a 30-day snapshot of six B2C stores. It then climbs to 1.08% at 5 and 1.81% at 7, so a single per-second rule doesn't fit this data. Portent's text says 1 second beats 5 seconds by 2.5x, the chart gives 2.8x (our calculation), and there are no significance tests.
The same shape appears on one retail site's mobile pages, where conversion fell below 1% at 4.2 seconds and flattened out near 0.6% from about 5.7 seconds (SOASTA, 2015). In Akamai's 2017 data, conversion peaked at about 1.8 seconds on desktop (12.8%), 1.9 on tablet (7.2%) and 2.7 on mobile (3.3%), per the same Weil summary.
Between 2 and 3 seconds, conversion runs about 2.05% against 1.59% across groups of pages in Yottaa's October 2025 post. A French-language Akamai white paper reports about 4.75% mobile conversion at 3.3 seconds and 3.52% one second later, from a single Cyber Monday. To set these rates against a normal baseline, see conversion rate benchmarks by industry.
Lead-generation sites show a similar slope. Goal conversion on 14 B2B sites runs about 39% at 1 second, 34% at 2, 29% at 3 and 18% at 6 in Portent's 2022 data. Its text says 1 second beats 10 seconds by 5x and 5 seconds by 3x, and its chart gives about 2.3x and 1.8x (our calculation).
LCP, INP and CLS against conversion
In the two datasets that split all three Core Web Vitals, LCP and INP track conversion while CLS stays flat. At Shopify, 32 ms of slower INP went with about 1.5% lower conversion, with more noise than LCP, and CLS showed no such pattern (Shopify, 2026). Shopify read INP and CLS at the 90th percentile. Across Yottaa's page groups, conversion runs about 2.25% at a 1.3-second LCP against 1.50% at 2.5 seconds, and about 4.44% at a 50 ms INP against 3.91% at 200 ms, while CLS stays flat at about 1.99% (Yottaa, October 2025).
Retail users with good INP converted at about 2.5% against 2.0% for the rest, in Contentsquare's 2023 data from 997 customer sites, also vendor data. Rakuten 24's A/B test, in the case studies below, points the other way, since its largest measured improvement was CLS.
Order value and funnel stage
Speed went with bigger orders as well as more of them in Deloitte's retail data. A 0.1-second gain went with about 9.2% higher order value and 5.2% more page views per session, across 15 retail brands and 20.5 million sessions from October 28 to November 24, 2019. Within the , listing to product page rose about 3.2% and product page to basket about 9.1%. The lift shrank to about 1% at the basket, and homepage to listing fell about 0.5% (PDF).
Shoppers were more sensitive to slowdowns at the checkout stage in the Gallino paper, which also reports diminishing sensitivity as slowdowns grow. That sits awkwardly beside Deloitte's small lift at the basket, and the methods differ, so check both ends of your own funnel rather than picking one (our reading).
Slowdowns outside retail
Outside retail, slowdowns show up in traffic and searches as well as conversions. In the same Deloitte study, a 0.1-second gain went with about 10.1% more travel conversions, and bounce rate on lead-generation information pages fell by about 8.3%, both correlations.
A 400 ms slowdown cost Yahoo about 5% to 9% of full-page traffic, meaning users who left before the page finished loading, in a 2008 slide. In a 2006 Google experiment, showing 30 search results instead of 10 slowed pages from 0.4 to 0.9 seconds and cut traffic and revenue by about 20%. That test changed the page as well as its speed, and Kohavi and colleagues estimate a pure 500 ms effect at about 3%.
Searches per user fell about 0.59% over six weeks when Google added a 400 ms delay in a 2009 controlled test, and about 0.21% remained in the five weeks after the delay was removed. A slow experience kept costing Google searches after the fix, which is the more useful lesson for a store (our reading).
About 10% of users leave for every additional second a page takes to load, a BBC architect said, with no data or method published. One second of LCP went with about a 14-point lower bounce rate and 13% more conversions in Renault's regression, where a conversion is a completed lead form.
Key takeaway: Speed and sales move together in every large retail dataset here, but most of those datasets compare faster and slower sessions or stores. The few controlled reports that publish a 100 ms result range from about 0.6% to 1%, across different businesses, metrics and years, so they aren't a transferable benchmark. Don't multiply any per-100 ms figure across seconds. Build conservative scenarios from your own revenue and test large changes.
Check any store's Core Web Vitals, on any platform
Store case studies: tests and before-and-after results
Case studies tend to get published when they go well, and most of these sit on sites run by Google or Shopify, so take them as what is possible. Only the first group below ties its result to a test or experiment, so give it more weight. Zalando's and Amazon's A/B tests appear in the 100 ms comparison above.
Reported tests and experiments
- Vodafone saw about 8% more sales with a 31% better LCP in a 50/50 A/B test in 2021, on a landing page with paid traffic at around 100K clicks and 34K visits a day per version. Lead-to-visit improved about 15% and cart-to-visit about 11%.
- Rakuten 24 reports about 53.37% more revenue per visitor, 33.13% higher conversion, 15.20% higher order value and a 35.12% lower from a month-long 50/50 test on one landing page in Japan. Rakuten's largest measured improvement was CLS, a visual stability metric, rather than load time. The two versions had no other functional or visual differences. CLS improved about 92.72%, FCP 8.45% and TTFB 18.03%, and the page finished about 0.4 seconds earlier. Sample size isn't stated, and the result is an outlier here (our reading).
- Trendyol saw about 1% more click-through to product after it A/B-tested a 50% INP cut on listing pages. It doesn't publish the sample size or significance, so treat that as directional.
- Ray-Ban's mobile conversion rose about 101% and desktop about 156%, the largest lifts in this section, in a January 2025 case study that reports A/B testing of prerendered product pages. The exit rate fell about 13% and mobile LCP went from 4.69 to 2.66 seconds. It compares visitors who got a prerendered page with those served from the server, and prerendering targets pages a visitor is likely to open, so keen buyers may be overrepresented (our reading).
- Etsy saw about 12% higher bounce on mobile after adding 160 KB of hidden images to a page, in a performance experiment that Lara Hogan, then at Etsy, describes without publishing the sample or design.
- Farfetch reports about a 1% to 5% conversion on product pages after it tested an image-loading change by A/B test.
Before-and-after and observational results
| Store | Design | Reported result |
|---|---|---|
| Carpe, 2023 | Before and after | 52% faster LCP, 5% conversion |
| Sunday Citizen, 2022 | Before and after | 25% better LCP, 6%+ conversion |
| Relive, 2025 | Before and after, 90 days | 50%+ better LCP, 3% conversion |
| Swappie | Before and after, 3 months | 55% lower LCP, 42% mobile revenue |
| Staples, about 2014 | Before and after | 1 s faster home page, about 10% conversion |
| Agrofy Market, 2020 | Before and after | 70% better LCP, abandonment 3.8% to 0.9% |
| Furnspace | Vendor case, undated | 65% faster, purchases doubled |
| Tokopedia | Method not stated | 35% click-through, 8% conversion |
| Nuvemshop, 2026 | Year on year | Good LCP from 57% to 96% of stores, 8.9% conversion |
| eBay, 2019 | Method not stated | 100 ms faster search, 0.5% add to cart |
| Missguided, 2018 | Platform split | About 4 s faster, about 26% revenue |
| Walmart, 2012 | Method not stated | 1 s faster, up to 2% conversion |
The before-and-after rows have no control group, so other changes could explain them. Nuvemshop reports platform-wide results between January 2025 and January 2026, with Core Web Vitals passing rising from about 48% to 72% of stores. Its 8.9% covers mobile visitors from Google organic search. The text describes Brazilian stores, while a table note says the values are averaged across regions. The platform's own team wrote it and gives no store count for that comparison.
Carpe also reports about 10% more traffic and 15% more revenue, which can have many other causes. Sunday Citizen reports about 61% better CLS and a 4% lower bounce rate, and Relive a 6% lower bounce rate. Furnspace's claim comes from the vendor that sold the tool, which ties no result to the A/B tests it mentions.
Missguided's is a rare direct look at one third-party app. It removed a review widget for Android visitors only and compared against other platforms, so it isn't randomized, and its slide labels are ambiguous. Walmart's deck compares load times of buyers and non-buyers without saying how its per-second figure was derived. For a work list, the Shopify speed guide and the 8-issue speed diagnostic give an order of fixes.
How load time affects bounce and abandonment
About 53% of mobile visits were abandoned when a page took longer than 3 seconds, in Google Analytics benchmark data on about 3,700 mobile sites worldwide in March 2016, part of a wider study of 10,000 domains (DoubleClick by Google, published September 2016). The report doesn't define "abandoned", and the figure covers the general web.
Measured abandonment comes out far lower when it stops at first paint. About 14.4% of Android and 6.1% of Windows page loads were abandoned before first paint at 3 seconds, and about 33.1% and 14.0% at 10 seconds, in Chrome's data published by a Chrome engineer in December 2020. The same post says slower pages are about 24% more likely to be abandoned.
Each row below answers a different question about the 3-second mark, so the numbers don't conflict and shouldn't be averaged.
| Result | What it counts, about 3 s | Source |
|---|---|---|
| 53% | Mobile visits abandoned past 3 s | Google, 2016 |
| 14.4% | Left before first paint, Android | Chrome, 2020 |
| 6.1% | Left before first paint, Windows | Chrome, 2020 |
| +32% | Modeled bounce probability, 1 s to 3 s | Google/SOASTA, 2017 |
| 40% | Say they'd wait 3 s at most | Forrester for Akamai, 2009 |
| 53% | Say they expect store pages within 3 s | Digital.com, 2022 |
| 27% (8+19) | Say they leave within 3 s | Digital.com, 2022 |
| 26.9% | Say they wait 1 to 3 s on a phone | Unbounce, 2018 |
Google's models describe bounce and load time as a slope, in relative terms. Bounce probability rises about 32% from 1 to 3 seconds and 123% from 1 to 10 seconds in a 2017 Google and SOASTA deep neural network (Google). Its chart and page 3 of the 2017 PDF add +90% at 5 seconds and +106% at 6 seconds, both against 1 second. These are relative changes with no baseline, so +32% is not 32 points.
Bounced sessions were about 2.5 seconds slower at the median, and DOM ready about 55% slower, in an earlier 2016 Google model on mobile stores.
Most of the measured store data on bounce below comes from vendors' own customers, and the sources read here include no independent store study of bounce from the past five years. Ecommerce pages loading within 2 seconds averaged about a 9% bounce rate and pages at 5 seconds about 38%, topping out near 73%, in Pingdom's 2018 ecommerce segment, which gives no sample size. On one retail site's mobile pages, bounce ran about 12.8% at 2.4 seconds against 20% at 3.3 seconds (SOASTA, 2015, archived copy).
Mobile pages over 4 seconds show a bounce rate of about 63%, against around 45% for faster pages, in Yottaa's 2022 and 2025 figures. Yottaa's number amounts to a gap of about 18 points, since many shoppers bounce from fast pages too. A Yottaa summary says about 66% for the same claim, and an earlier Yottaa post (archived copy) says 2 out of 3 shoppers bounce past 6 seconds, citing the same 2022 standard.
One second saved went with about 11.7% lower bounce on desktop and 8.9% on mobile in Yottaa's 2022 standard, and 1.9 seconds off product pages with about 8% lower bounce in a 2025 Yottaa post. A 2-second delay raised bounce by about 103% in Akamai's 2017 analysis, read here through a news report.
A 0.1-second gain went with about 5.7% lower bounce on product listings in Deloitte's retail table, against 0.6% on the home page and 1.9% on product pages. Load-time frustration showed up in about 11.6% of retail sessions in 2025 in Contentsquare's 2026 benchmark, which doesn't say what those sessions did next.
The point where bounce stops changing with speed ranged from 500 ms to 5.6 seconds across a month of real-user data from ten retailers (Tammy Everts for Embrace, July 2026, a vendor). It came before 2.5 seconds on four of the ten sites, and the lowest bounce came at an LCP between 100 ms and 1 second. She calls it "a methodology, not a number." Plot bounce against LCP on your own store before you set a target.
What shoppers expect and say about slow pages
All of this section is stated behavior, meaning people describing what they think they do. Questions about whether someone has ever left a slow site produce very high numbers, because nearly anyone has done it once. Give more weight to surveys that ask about a specific wait, and name the sponsor when you cite any of them.
How long shoppers say they will wait and what they expect
About 40% of shoppers said they would wait no more than 3 seconds before leaving a retail or travel site, and about 47% expected a page within 2 seconds, in a Forrester Consulting survey of 1,048 US online shoppers for Akamai in July 2009 (Akamai's release, archived copy). The 40% adds up four answers (27+10+2+1), and the 47% is a similar sum (30+12+5). About 60% said they would wait more than 4 seconds.
About 8% of 1,250 American adults say they leave after 1 second, 19% after 2 to 3 seconds and 25% within 4 to 6 seconds, a running total of 52% by 6 seconds (8+19+25). That comes from Digital.com's survey (archived copy), run on January 16, 2022 for a comparison site, where about 53% also expected ecommerce pages within 3 seconds.
The most common stated wait on a phone is 4 to 6 seconds, longer than the often quoted 3, in Unbounce's 2018 survey of US consumers through Google Surveys.
| Wait on a phone before leaving | Share (Unbounce, n=599) |
|---|---|
| 1 to 3 seconds | 26.9% |
| 4 to 6 seconds | 32.3% |
| 7 to 10 seconds | 24.0% |
| 11 to 13 seconds | 5.3% |
| Over 13 seconds | 11.5% |
At 3 seconds, almost half say they would refresh at least once, about 22% would close the tab and about 14% would visit a competitor. About 74% of more than 4,000 mobile users worldwide said they would wait 5 seconds or less for a page in a July 2011 Compuware survey, as reported by GMA News.
About 52% of 1,500 US monthly online shoppers say they leave past 10 seconds, and 18% would wait 20, in Clutch's 2025 survey, read through a trade report. An average stated wait of about 8 seconds comes from Forbes Advisor's 2024 survey of 2,000 US adults, also read through another report.
About 1 in 4 of 4,000 US and UK consumers say they abandon an online purchase that doesn't complete within 10 seconds, in Conviva's February 2025 survey. That question covers the whole transaction, at about 26% for marketplaces and 25% for fashion retailers. About 54% of 1,131 US smartphone owners say frustration grows with mobile load time, per Google and Civic Science in 2018.
About 85% of 2,469 US adults expected the mobile experience to be as good as or better than on a computer, in a 2011 survey by Harris Interactive for Tealeaf. The question covers the whole experience rather than load speed.
What shoppers say a slow page costs
Nearly 70% of consumers say page speed affects their willingness to buy from an online retailer, the headline finding of Unbounce's poll of 750 US consumers in October and November 2018. The report doesn't show the question behind that figure. Its closest chart asks what people do when an ecommerce site loads slower than expected: about 45.4% say they are less likely to buy, 36.8% less likely to return and 11.9% likely to tell a friend. Roughly another 22.5% chose none of those (n=525).
In the same survey, about 56.6% would give up animations for faster loading, 52.8% videos and 24.1% photos (n=542). Asked what they blame when a site fails to load, about 50.5% said their connection, 34.2% the website and 15.4% their carrier (n=534). Unbounce sells landing pages.
About 79% of shoppers with a dissatisfying visit were less likely to buy from that site again, and 64% were ready to buy from another store, in the 2009 Forrester survey for Akamai. Those two figures cover any kind of dissatisfaction, and about 23% of those shoppers named a slow site as the reason (live copy of the release). About 44% of shoppers would tell friends about a poor experience, per a 2011 Kissmetrics infographic.
About 88% of those who abandon low-performing websites are less likely to return to the site, per MarketingProfs' chart of a Gomez survey published in 2010, which polled about 1,500 people who had made online transactions. The figure covers any poor performance, with no load-time threshold. A later Gomez survey has about 37% saying they "would not return to a slow site". In Digital.com's 2022 survey, about 45% reported a negative impression of the business.
The "ever" questions come from vendors and run highest. About 90% of 1,300 US shoppers had left a store that didn't load in the time expected, in 2019 research by RSR Research for Yottaa. About 57% had left a slow store and bought from a similar retailer, 40% had left and bought from Amazon, and 23% never returned.
About 76% of 1,007 US consumers had abandoned a cart over slow speed and 55% had switched to a competitor, in Liquid Web's 2024 survey. About 88% of 2,000 UK adults had left a purchase over load time, per YouGov for BHOST, in a 2026 news report with no fieldwork dates.
Ask about reasons for not buying and speed shrinks. About 10% blamed slow downloads for not purchasing in a Forrester figure reprinted by Deloitte. Baymard's list of checkout abandonment reasons shows no site-speed item, which may reflect its answer options: "slow" there means delivery, at about 20%, and "Website had errors / crashed" sits at about 17%. That gap, 76% to 90% in "ever" questions against about 10% among stated reasons, is a good reason not to quote any single survey as fact.
Speed is one part of it, so check the rest of your store
Mobile versus desktop
US store owners should be careful with mobile-first numbers, because desktop still leads US page views across all sites. StatCounter's October 2026 data has desktop at about 52.4% and mobile at 45.43% in the US, against 59.9% mobile and 38.51% desktop worldwide. None of that is ecommerce-specific, so check your own analytics first.
On field data, all sites combined do better on desktop, at about 60.8% good Core Web Vitals against 52.8% on mobile worldwide, and 65.4% against 63.3% in the US (HTTP Archive). The Web Almanac 2025, a different cut, has about 56% against 48%, and good LCP at 74% against 62%.
Stores don't all follow that pattern. Shopify is about 79.5% on desktop against 76.2% on mobile worldwide, but 82.7% against 85.5% in the US. BigCommerce runs lower on desktop at about 55.6%, and WooCommerce is level at 39.3%. In EcomHint's benchmark, most desktop misses are about layout: 238 of the 347 stores that miss on desktop fail on CLS alone.
Lab data shows a wider gap. HTTP Archive's median onLoad runs about 67% longer on mobile than on desktop (our calculation from 7.77 and 4.65 seconds).
About 73% of mobile users who had a problem reaching a site met slow loading, the most common problem (almost three-quarters "of those who had a problem"). The figure comes from a 2009 Gomez survey of about 1,000 mobile web users, run by Equation Research. About 60% had a problem in the past year, so slow loading reached about 44% of all respondents (our calculation). About 51% met a crash or error and 38% an unavailable site, per the Kissmetrics infographic, very likely on the same base (our reading).
Test beyond the homepage, because inner pages behave differently. The Web Almanac 2025 has inner pages passing more often than home pages, at about 56% against 45% on mobile and 61% against 47% on desktop, with caching as one suggested cause. Yet good mobile INP drops to about 69% on inner pages from 80% on home pages, which the chapter links to filters, carousels and form validation. Product and category pages make up about 72% of page views in Yottaa's 2022 figure. The ecommerce product page statistics cover what else shoppers expect there.
What slows online stores down
Third-party services show the strongest relationship with speed scores in EcomHint's data, at r = -0.66 across 1,533 Shopify stores. Here a "service" is an entity Lighthouse detects from network requests, which differs from the number of apps in your admin. Median mobile scores run 74 at 0 to 5 services, 59 at 11 to 15, 44 at 21 to 30 and 30 at 51 or more (benchmark). This is a correlation, so it doesn't show that removing a service raises a score by a set amount.
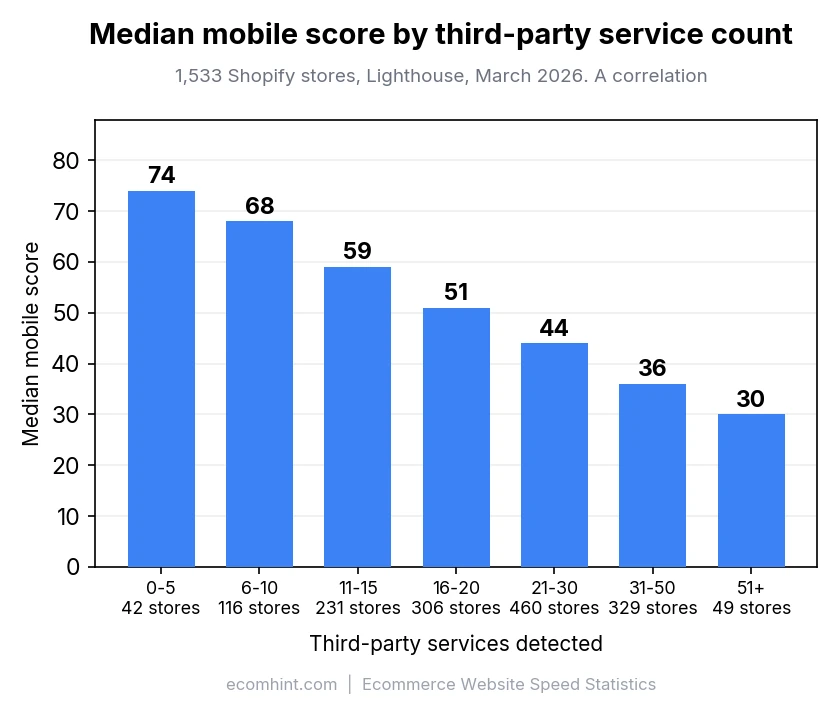
is on about 90% of those stores and blocks the main thread for a median of about 486 ms. Beauty & Personal Care stores load a median of 31 services and Automotive Parts 15, the same two industries at the ends of the pass-rate table above. The third-party apps analysis breaks this down by service.
In this data scores spread further across service counts than across themes. Across the 21 themes with at least 10 stores, median mobile scores run from 39 to 62, a 23-point spread, against 44 points across the service bands (our subtraction). Dawn, on about 100 stores, scores a median of 55 with about 91% passing Core Web Vitals on mobile.
Third-party apps take about 44% of page load time in Yottaa's January 2025 vendor data, and nearly 60%, with 40+ apps per page, in September 2025, on a changed set of sites. Yottaa says each poorly optimized app cuts conversions by an average of about 0.29%, without saying whether that is relative or absolute. Its ratings class about 15% of third-party technologies as a consistent drag, 47% as inconsistent and 38% as minimal. Each script adds about 34.1 ms in Backlinko's 2019 data, general web and correlational.
Images are the next place to look, because an image is the LCP element on about 77% of the stores in the benchmark. The Web Almanac 2025 finds a similar pattern across all sites, at about 76% on mobile and 85.3% on desktop, and about 16% to 17% of pages lazy-load that image. Converting sessions had about 38% fewer images in Google's 2016 model.
Median page weight runs about 6,292 KB for homepages, 5,628 KB for product pages and 4,777 KB for collection pages in the benchmark's Consumer Goods slice of 225 stores. Product pages carry about 10% more JavaScript than homepages in that slice, and 4% to 17% more across industries, with 689 KB to 1,063 KB of it unused. For scale, the median mobile home page across all sites weighs about 2.56 MB, with 911 KB of images and 632 KB of JavaScript.
Median mobile reached about 1,916 ms in lab tests, up about 58% from 1,209 ms in 2024, against 92 ms on desktop (Web Almanac 2025). For the order of fixes, see the site speed checklist.
Site speed and SEO
For SEO, read speed as one signal among many, behind relevance. "Core Web Vitals are used by our ranking systems," says Google's documentation, updated in September 2026. It adds that good results don't guarantee top rankings, and that relevant content can win "even if the page experience is sub-par." The same page says "trying to get a perfect score just for SEO reasons may not be the best use of your time."
The timeline is clearer than the weight. Speed became a signal on desktop in April 2010, when Google said fewer than 1% of queries were affected. Mobile followed in July 2018, page experience in June 2021 and INP in March 2024.
First-page results load in about 1.65 seconds on average in Backlinko's study of 11.8 million results. The same page reports "zero correlation between site speed and Google rankings", from domain-level speed data rather than the ranking pages themselves.
Main sources and methods
These sources measure different things, which is why their numbers rarely line up. Field data records what real Chrome users got, lab data what a simulated phone got, and surveys what people say they do.
| Source | Method | Sample |
|---|---|---|
| HTTP Archive Technology Report, Sept 2026 | Chrome field data by detected platform | 8,569,446 mobile origins |
| Chrome UX Report, Sept 2026 | Chrome field data, all origins | 18,376,044 origins |
| Web Almanac, 2025 | Chrome field data plus crawl, July 2025 | 15,426,398 mobile sites |
| EcomHint benchmark, 2026 | Lighthouse plus Chrome field data, March 2026 | 1,533 Shopify stores |
| Google mobile benchmarks, 2018 | Speed Index over 4G | 11 million landing pages |
| Backlinko, 2019 | HTTP Archive lab data | 5.2 million pages |
| Shopify, 2026 | Store buckets by speed, 28 days, correlation | Actively selling stores, count not stated |
| Gallino et al., 2023 | Natural variation, peer reviewed | Retailer transaction data |
| Akamai and SOASTA, 2017 | Real-user data by load time, one month | About 10 billion visits |
| Deloitte for Google, 2020 | Regression on natural changes, Lighthouse lab speed | 37 brands (15 retail), 30 million sessions |
| Portent, 2022 | Correlation, 30 days, 5.6 million sessions | 20 sites (6 B2C, 14 B2B) |
| Yottaa, 2025 | Vendor platform data | 500M+ visits, 1,300+ sites |
| Yottaa, 2022 | Vendor platform data | 16 billion page views, 250 retailers |
| Aberdeen Group, 2008 | Report part-sponsored by Gomez, method not stated | 160+ organizations |
| SOASTA, 2015 (archived copy) | Real-user data, one retail site, 30 days | Almost 4.5 million mobile sessions |
| Amazon via Greg Linden, 2006 | A/B tests, reported in a talk | Not published |
| Zalando, 2018 | Correlation, then A/B test | Not detailed |
| Google, 2009 | Controlled 400 ms delay, six weeks | Search users, size not published |
| DoubleClick by Google, 2016 | Google Analytics benchmarks, March 2016 | 3.7K mobile sites |
| Google and SOASTA, 2017 | Neural network model, 90% stated accuracy | Not disclosed |
| Embrace, 2026 | Real-user data, one month | 10 retailers |
| Forrester for Akamai, 2009 | Online survey, July 2009 | 1,048 US shoppers |
| Gomez, 2009 | Mobile user survey by Equation Research | About 1,000 mobile users |
| Gomez, 2010 | Survey of online buyers | About 1,500 people |
| Digital.com, 2022 (archived copy) | Pollfish survey, January 2022 | 1,250 US adults |
| Unbounce, 2018 | Google Surveys poll | 750 US consumers |
| RSR Research for Yottaa, 2019 | Shopper survey | 1,300 US shoppers |
FAQ
How fast should an ecommerce site load?
Aim for an LCP of 2.5 seconds or less at the 75th percentile of real visits, which is Google's current threshold for good. No single number fits every store. Across ten retailers in a 2026 analysis, the point where bounce stopped changing with speed ranged from about 500 ms to 5.6 seconds. Google's 2018 "under 3 seconds" guideline refers to Speed Index rather than load time.
What is a good website speed score?
Lighthouse labels 90 to 100 Good, 50 to 89 Needs Improvement and 0 to 49 Poor, and the score comes from a lab test. Peer benchmarks answer a different question: across 1,533 Shopify stores in EcomHint's benchmark, the median mobile score is about 47, and above 60 is top quartile in most industries. Check field data as well: about 1% of those stores pass LCP in the mobile lab test, while about 91% pass with real visitors.
How much does a one-second delay cost?
Estimates of what one second costs in conversion range from about 2% in Portent's 2019 data to roughly 30% in Shopify's 2026 analysis, and none of them reports a controlled test of a full second. The store A/B tests that publish a figure measure 100 ms: about 0.7% of revenue per session at Zalando and about 1% of sales at Amazon. Those don't scale cleanly to a second, so build scenarios from your own revenue rather than multiplying them.
Which ecommerce platform is fastest?
On HTTP Archive's September 2026 field data, Wix eCommerce leads the seven platforms compared here on good mobile Core Web Vitals, at about 79.5% worldwide, ahead of Shopify at 76.2%, with WooCommerce at 39.3%. Shopify leads worldwide on good LCP and good TTFB, at about 87.7% and 83.8%. These figures reflect who uses each platform as well as the software.
Does site speed affect SEO?
Yes, within limits. Google says Core Web Vitals are used by its ranking systems, and that good results don't guarantee top rankings. It also says "trying to get a perfect score just for SEO reasons may not be the best use of your time." A Backlinko study of 11.8 million results found zero correlation with domain-level speed.

Jakub is the founder of Ecomhint, an AI-powered ecommerce audit tool focused on UX and conversion optimization. He helps online stores identify friction points across product pages, cart, and checkout using CRO best practices and original research data.
Jakub is the founder of Ecomhint, an AI-powered ecommerce audit tool focused on UX and conversion optimization. He helps online stores identify friction points across product pages, cart, and checkout using CRO best practices and original research data.
